Once the laser scanning data for each site had been collected, it was then processed and converted into a variety of digital outputs. The type of raw data produced by the scanning process is called a ‘point cloud’, a set of millions of points located within three-dimensional space. After the data has been registered and the individual scans aligned, it can then be exported in a range of different formats. The most important outputs of this process are the 3D models, which consist of two different types: point cloud models and mesh models. In addition, the scan data can also be used to produce a range of different two-dimensional visualisations of the vault, including orthophotos, orthomosaics and rendered images.
Three-dimensional outputs
Point cloud models
Point cloud models are the simplest digital method for recording and modelling three-dimensional forms. Each point cloud consists of a set of millions of points located within a three-dimensional system of co-ordinates. Each individual point within the cloud has its own specific x, y and z values, defining their position relative to a shared centre. Due to the registration process, this centre remains the same even when the model is separated into different parts, allowing the relative position of every point to be maintained throughout recording and analysis.
Whilst it is possible to construct a point cloud model from the scanning data directly, it is normal to process the point cloud into a homogenised format. This helps to control the file size by eradicating duplicate or redundant points, sacrificing some precision for the sake of better clarity and ease of use. Point clouds always have a slightly ghostly appearance when viewed in 3D modelling software, as the gaps between the individual points remain visible. Yet whilst this can make them more difficult to engage with visually, they are closer in format to the original data, meaning that they can be more useful in certain specialised circumstances.
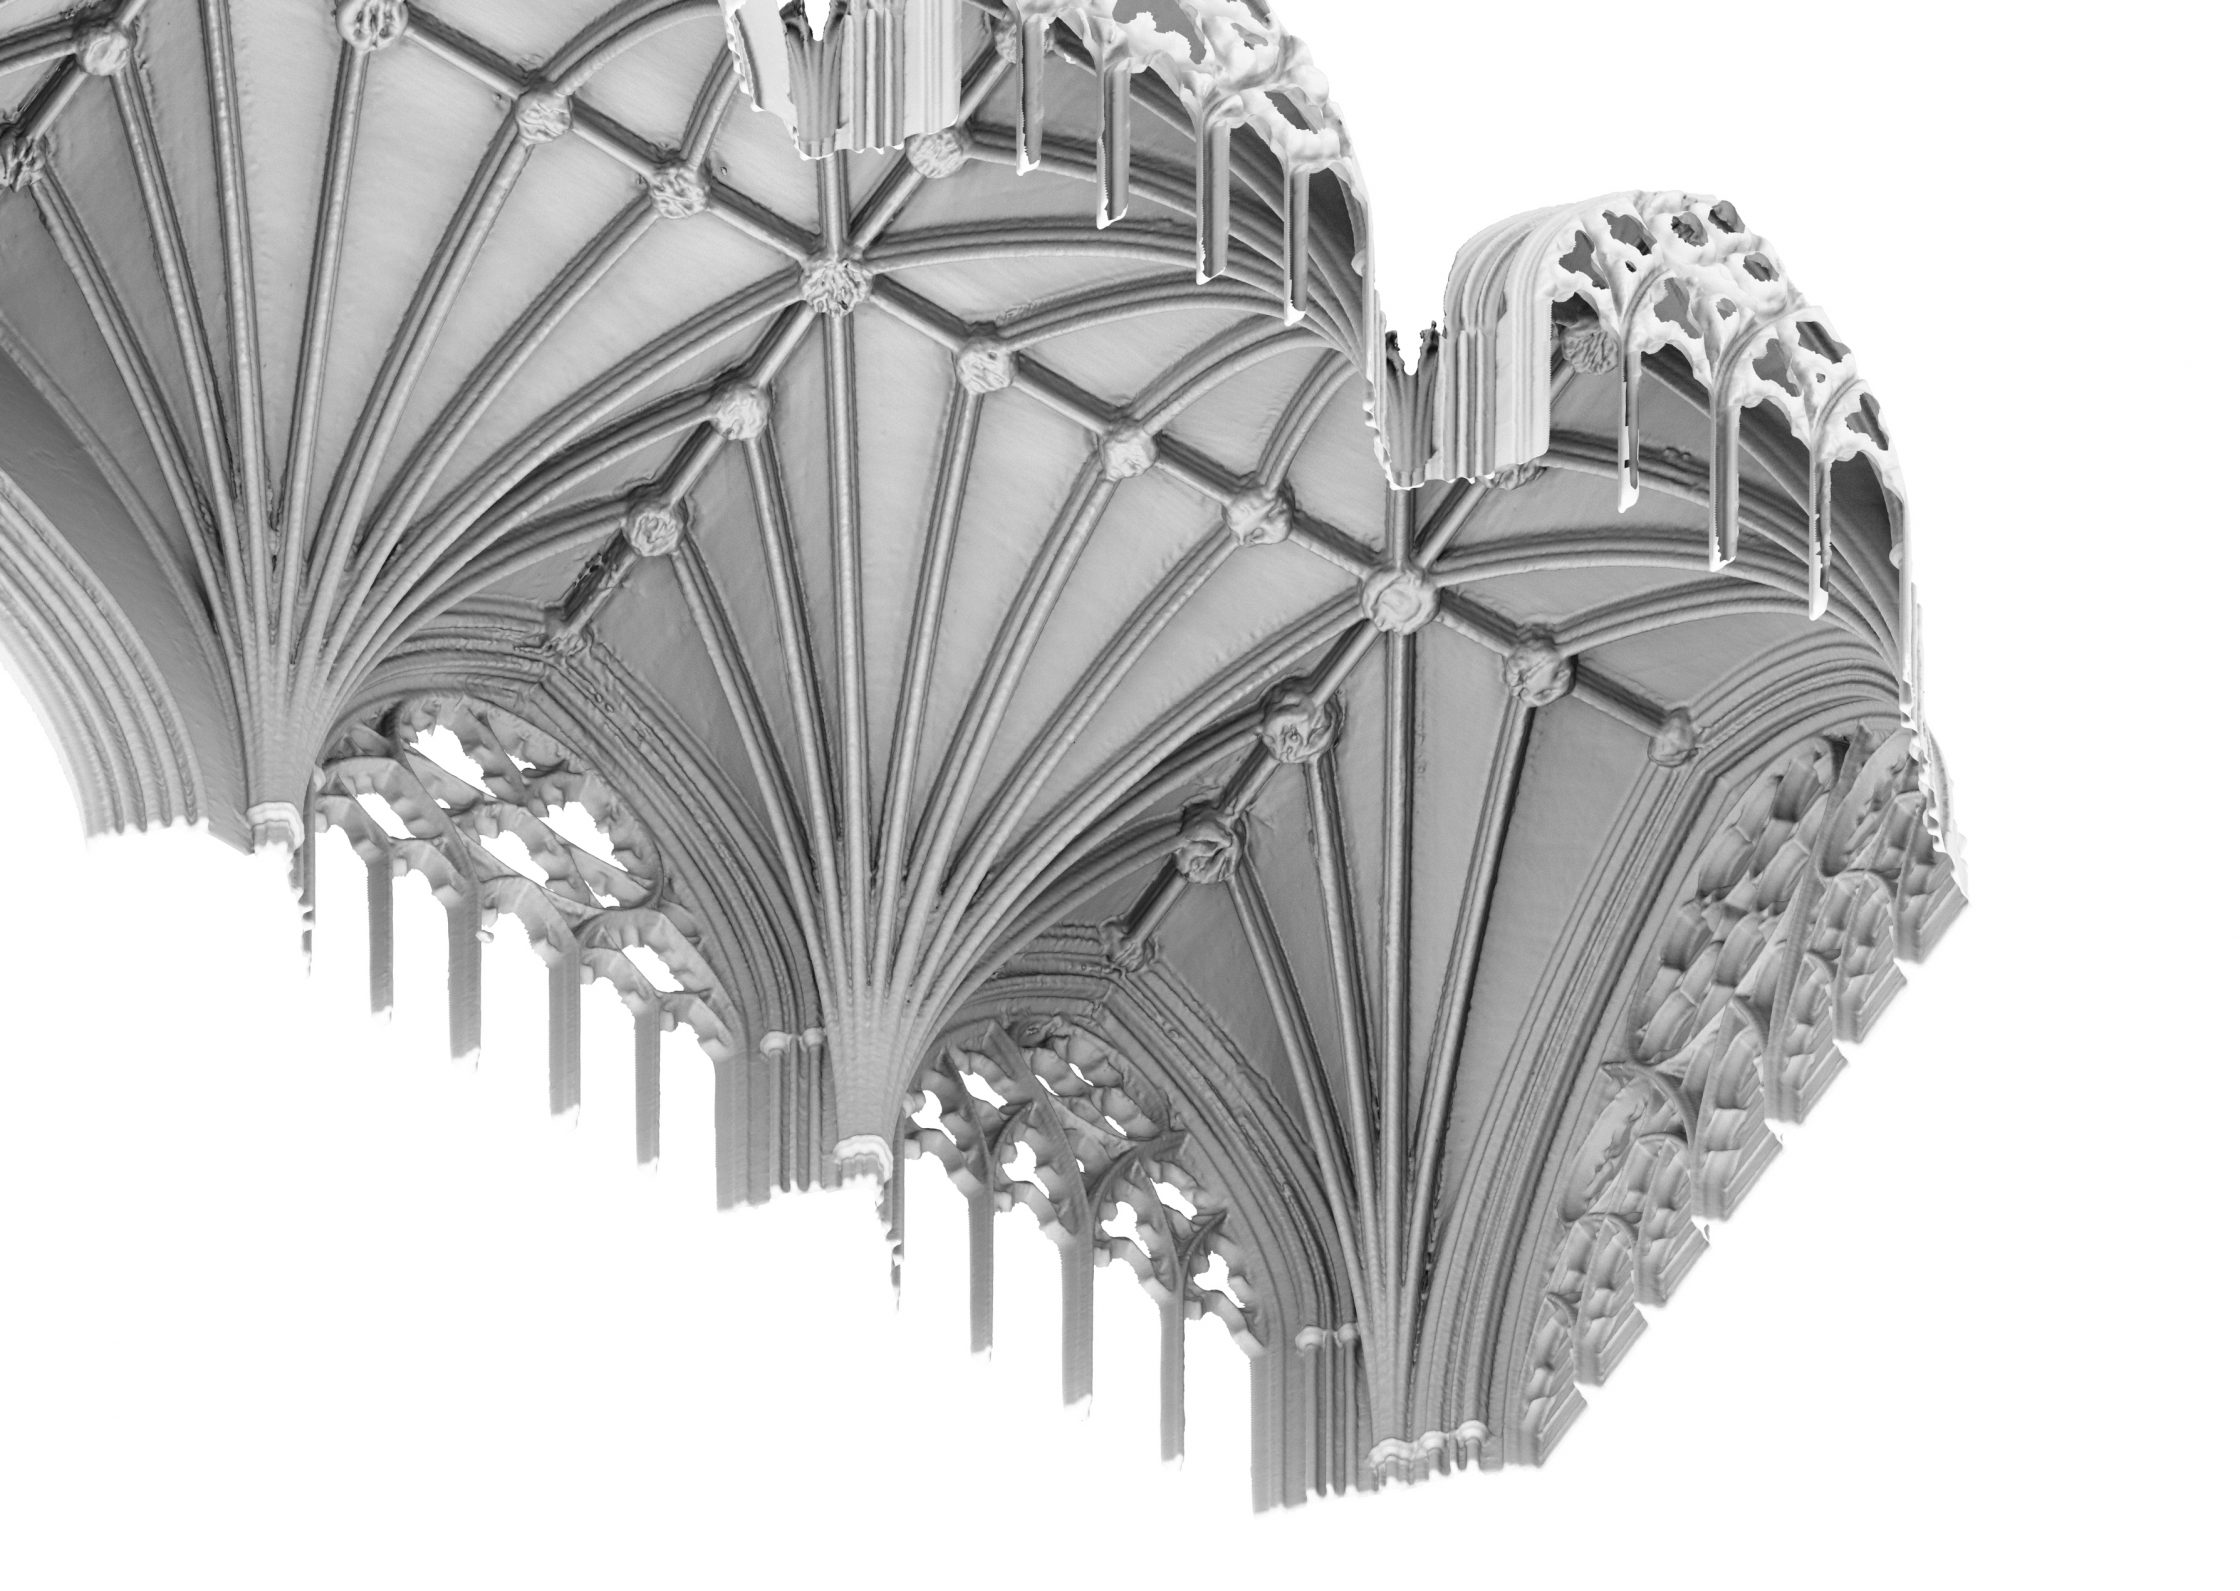
Mesh models
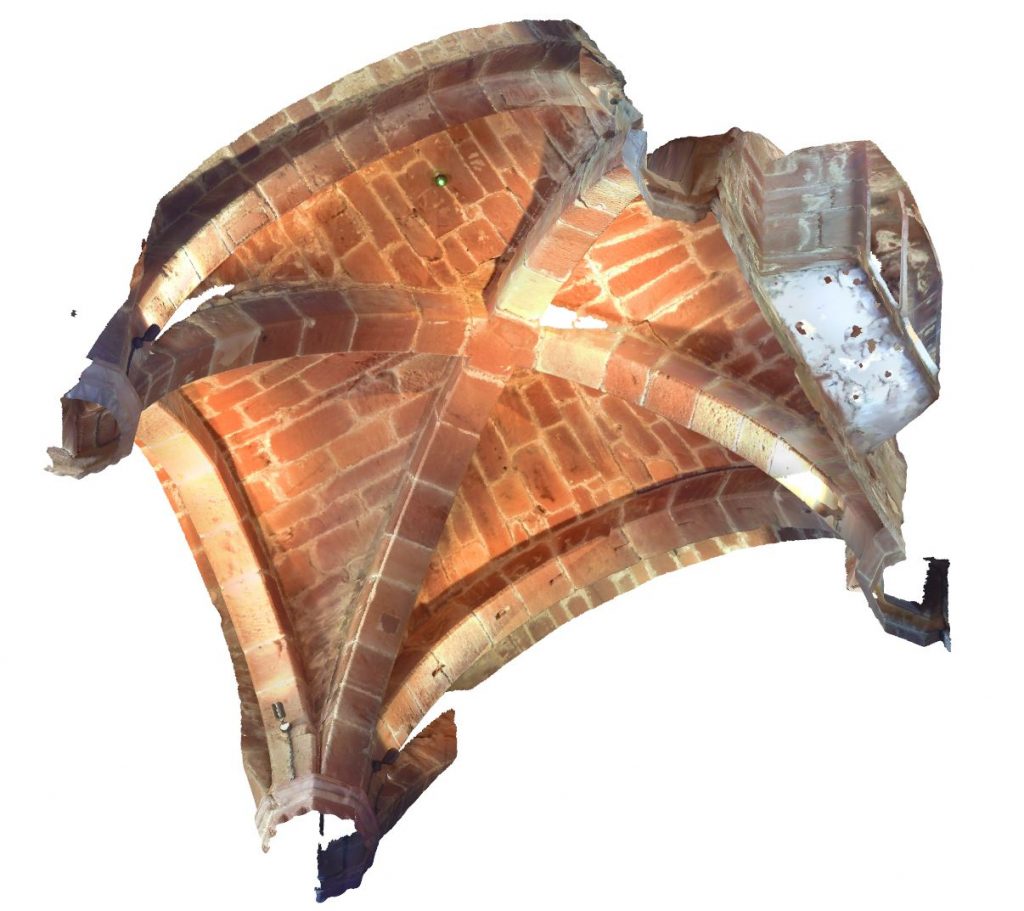
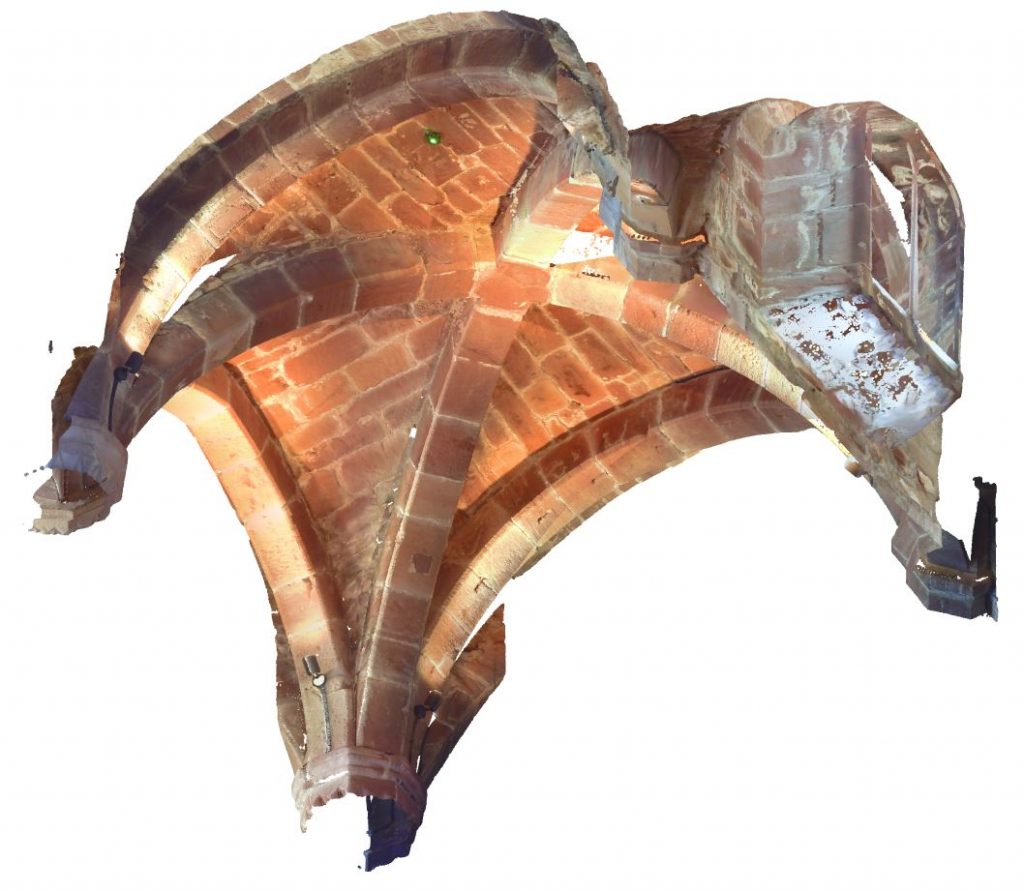
Mesh models are the result of an automated process through which a point cloud is converted into a three-dimensional surface. Each mesh model consists of a set of millions of vertices located within a three-dimensional system of co-ordinates. Each vertex is a point with its own specific x, y and z values as well as a normal vector defining their position and orientation within the model. All of these vertices are connected together in a mesh-like network of tessellating triangles, providing a three-dimensional surface which reproduces the form of the scanned object. The surface can then be covered with a texture derived from the scan data, an image reproducing the vault’s appearance from a series of photographs taken during the laser scanning process.
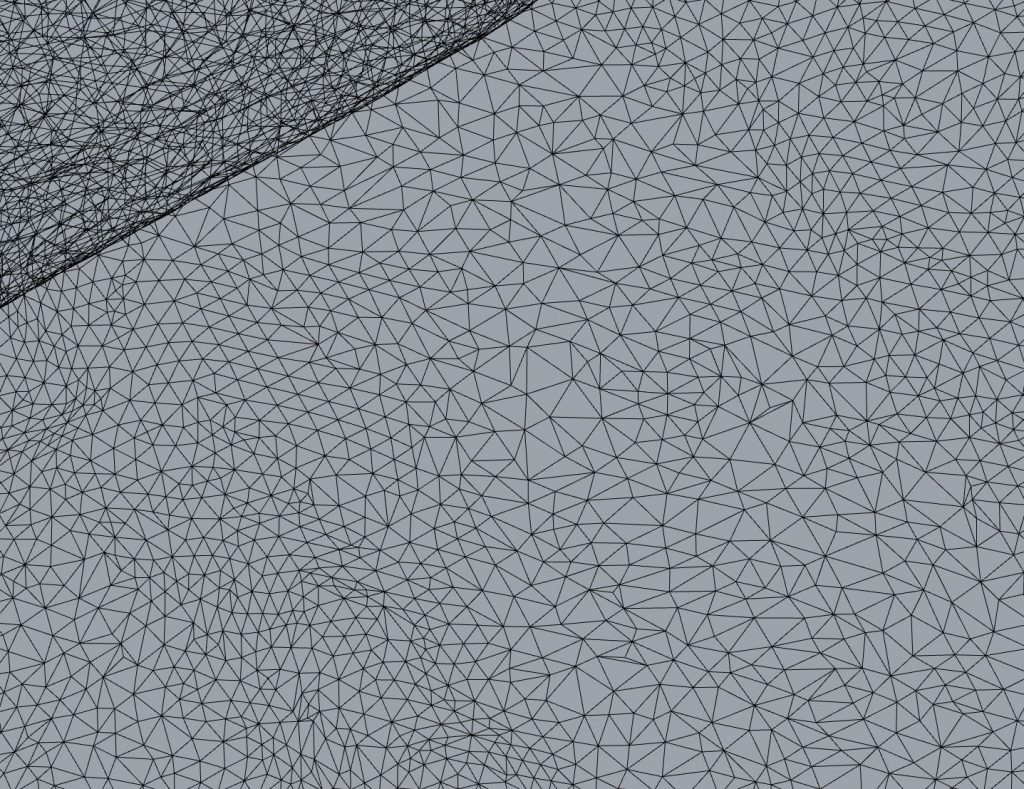
Unlike a point cloud, the surface of a mesh model is opaque. This results in better visual clarity when studying the vault, making it easier to trace the ribs or analyse its three-dimensional form. In addition, the surface texture can also be modified to show additional information about the data beneath, in particular when attempting to visualise the curvature of the webs.
Two-dimensional outputs
Orthophotos
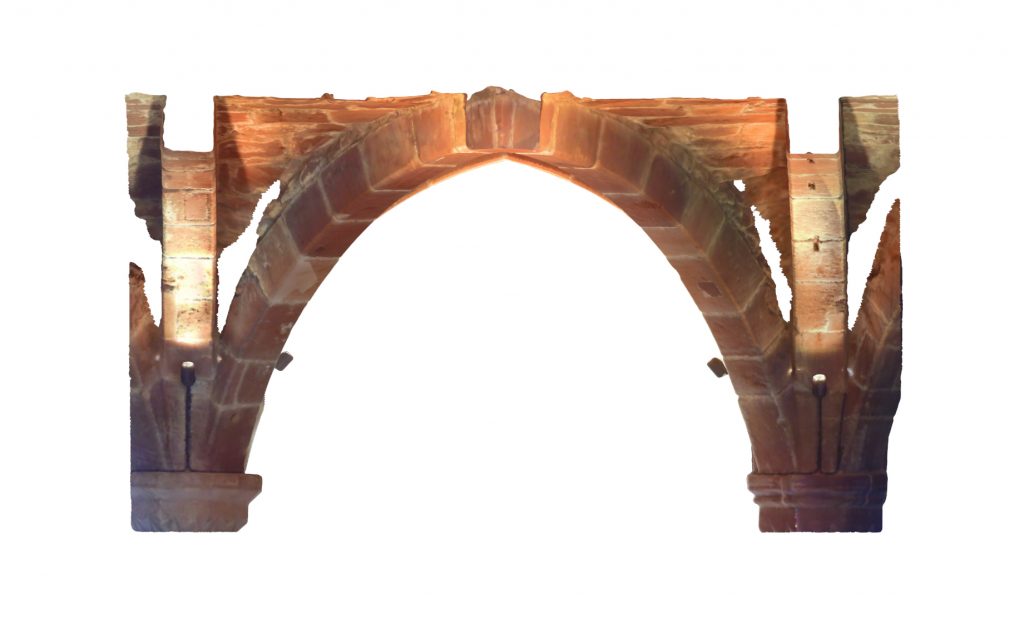
Orthophotos are orthographic representations generated from the scanned data, consisting of a flattened image devoid of any perspectival distortions. Once a point cloud has been processed, a clipping box can be used to define a viewing plane and an area of the model to be exported as an image. The position of each point within the box is projected perpendicularly onto the viewing plane. This allows an accurate image of the vault to produced from any conceivable angle, a process which is especially useful for producing accurate plans and sections. Measurements taken from these images are far more accurate than those in traditional plans and sections, allowing for direct comparison between individual bays.
Orthomosaics
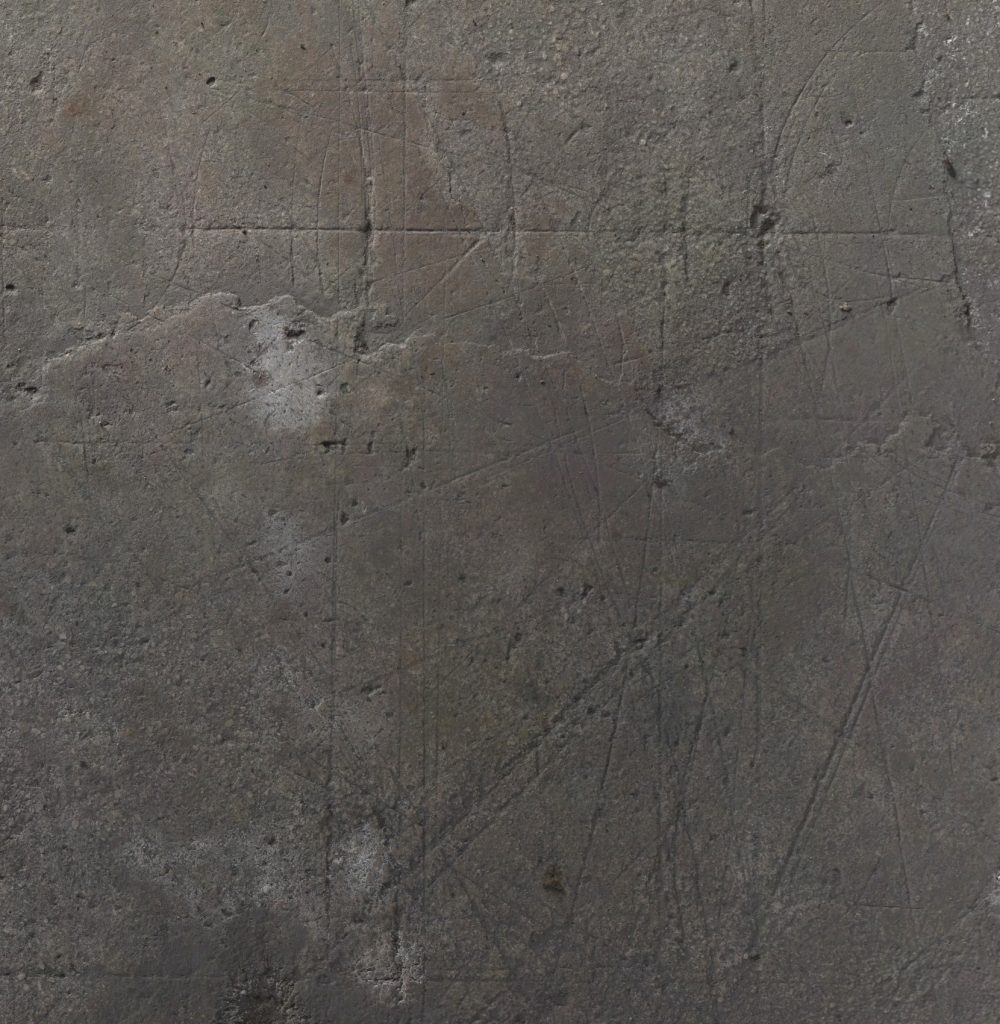
Orthomosaics are similar to orthophotos, but are developed using photogrammetry rather than laser scanning. Once a 3D model has been generated through this process, the photographs used to create it can be orthorectified automatically and composited into a single mosaic of tessellating images. These can also be clipped, selected and modelled from a specific viewing plane in the same manner as an orthophoto, allowing for highly accurate plans of the scanned object to be produced without perspectival distortions. This is especially useful for large flat surfaces such as the tracing floor at Wells Cathedral, as it allows the markings on the floor to be traced and measured accurately.
Rendered images
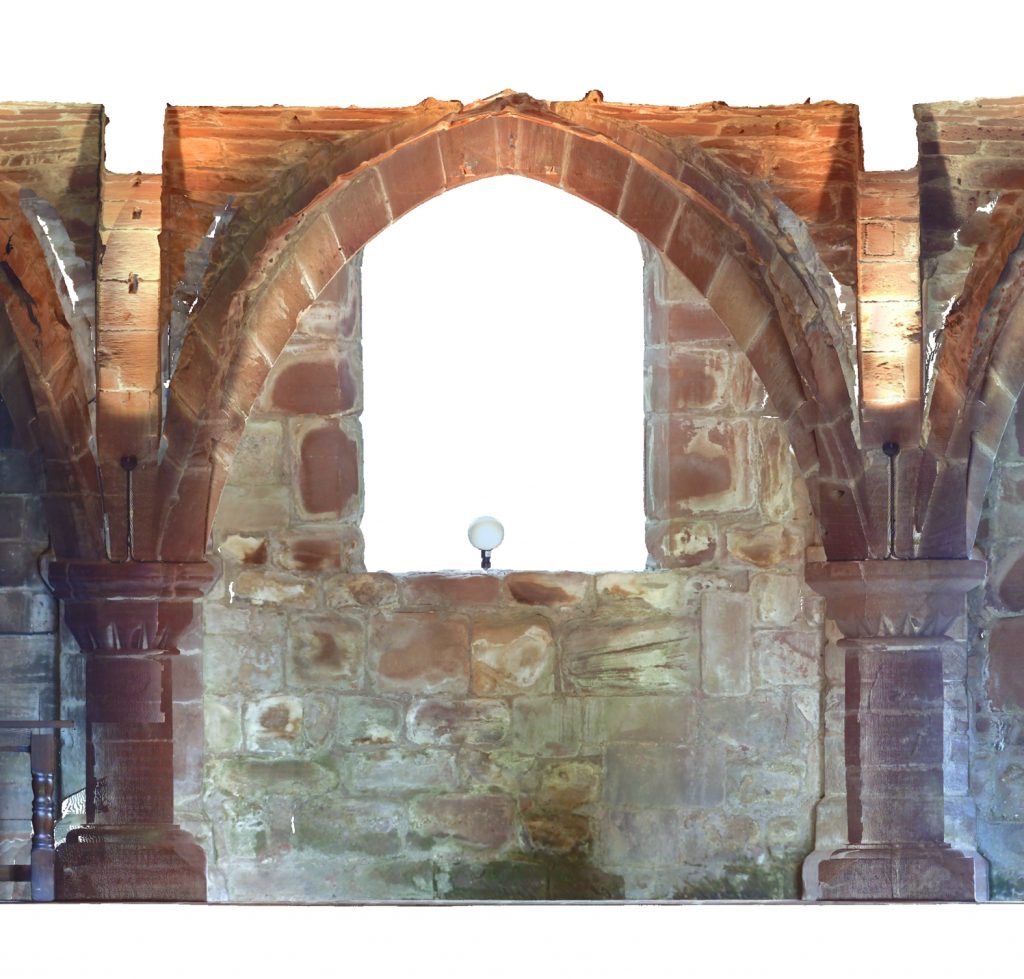
Two-dimensional images of the vaults can also be rendered directly from the mesh models using 3D modelling software. These are created within a full three-dimensional environment, including customisable lighting and other effects. A wide variety of perspectival techniques can also be applied, from orthographic representations to isometric projections to deliberate distortions. This provides a range of different means for visualising the vault and its component parts, allowing us to produce flexible, engaging images for publication purposes.
Further reading
- Buchanan, A., Hillson, J. and Webb, N., Digital Analysis of Vaults in English Medieval Architecture. New York and London: Routledge, 2021.
- Webb, N., Hillson, J., Peterson, JR, Buchanan, A. and Duffy, S. (2020). ‘Documentation and Analysis of a Medieval Tracing Floor Using Photogrammetry, Reflectance Transformation Imaging and Laser Scanning’, Proceedings of the 38th eCAADe Conference – Volume 2, TU Berlin, Berlin, Germany, 16-18 September 2020, pp. 209-218 (accompanying video)

3 Comments
[…] Find out more about our measurements Find out more about our 3D mesh models […]
[…] Find out more about our digital outputs […]
[…] Find out more about the process of producing digital models […]