After our measurements have been analysed statistically, it is time to begin interpreting the data by considering their implications for the vault’s design process. This analysis is conducted in two principal phases using a variety of different software platforms. The first focuses on the layout of the vault plan, specifically the underlying proportions of the pattern of ribs and their relationship with the geometrical figures available to designers. The second focuses on the curvatures of the ribs. By comparing and contrasting the measurements derived from our mesh models, we are able to suggest which methods might have been used to set out the rib geometries. Through combining these observation, we are able to produce hypotheses regarding the design process for each of our case study vaults.
Vault plans
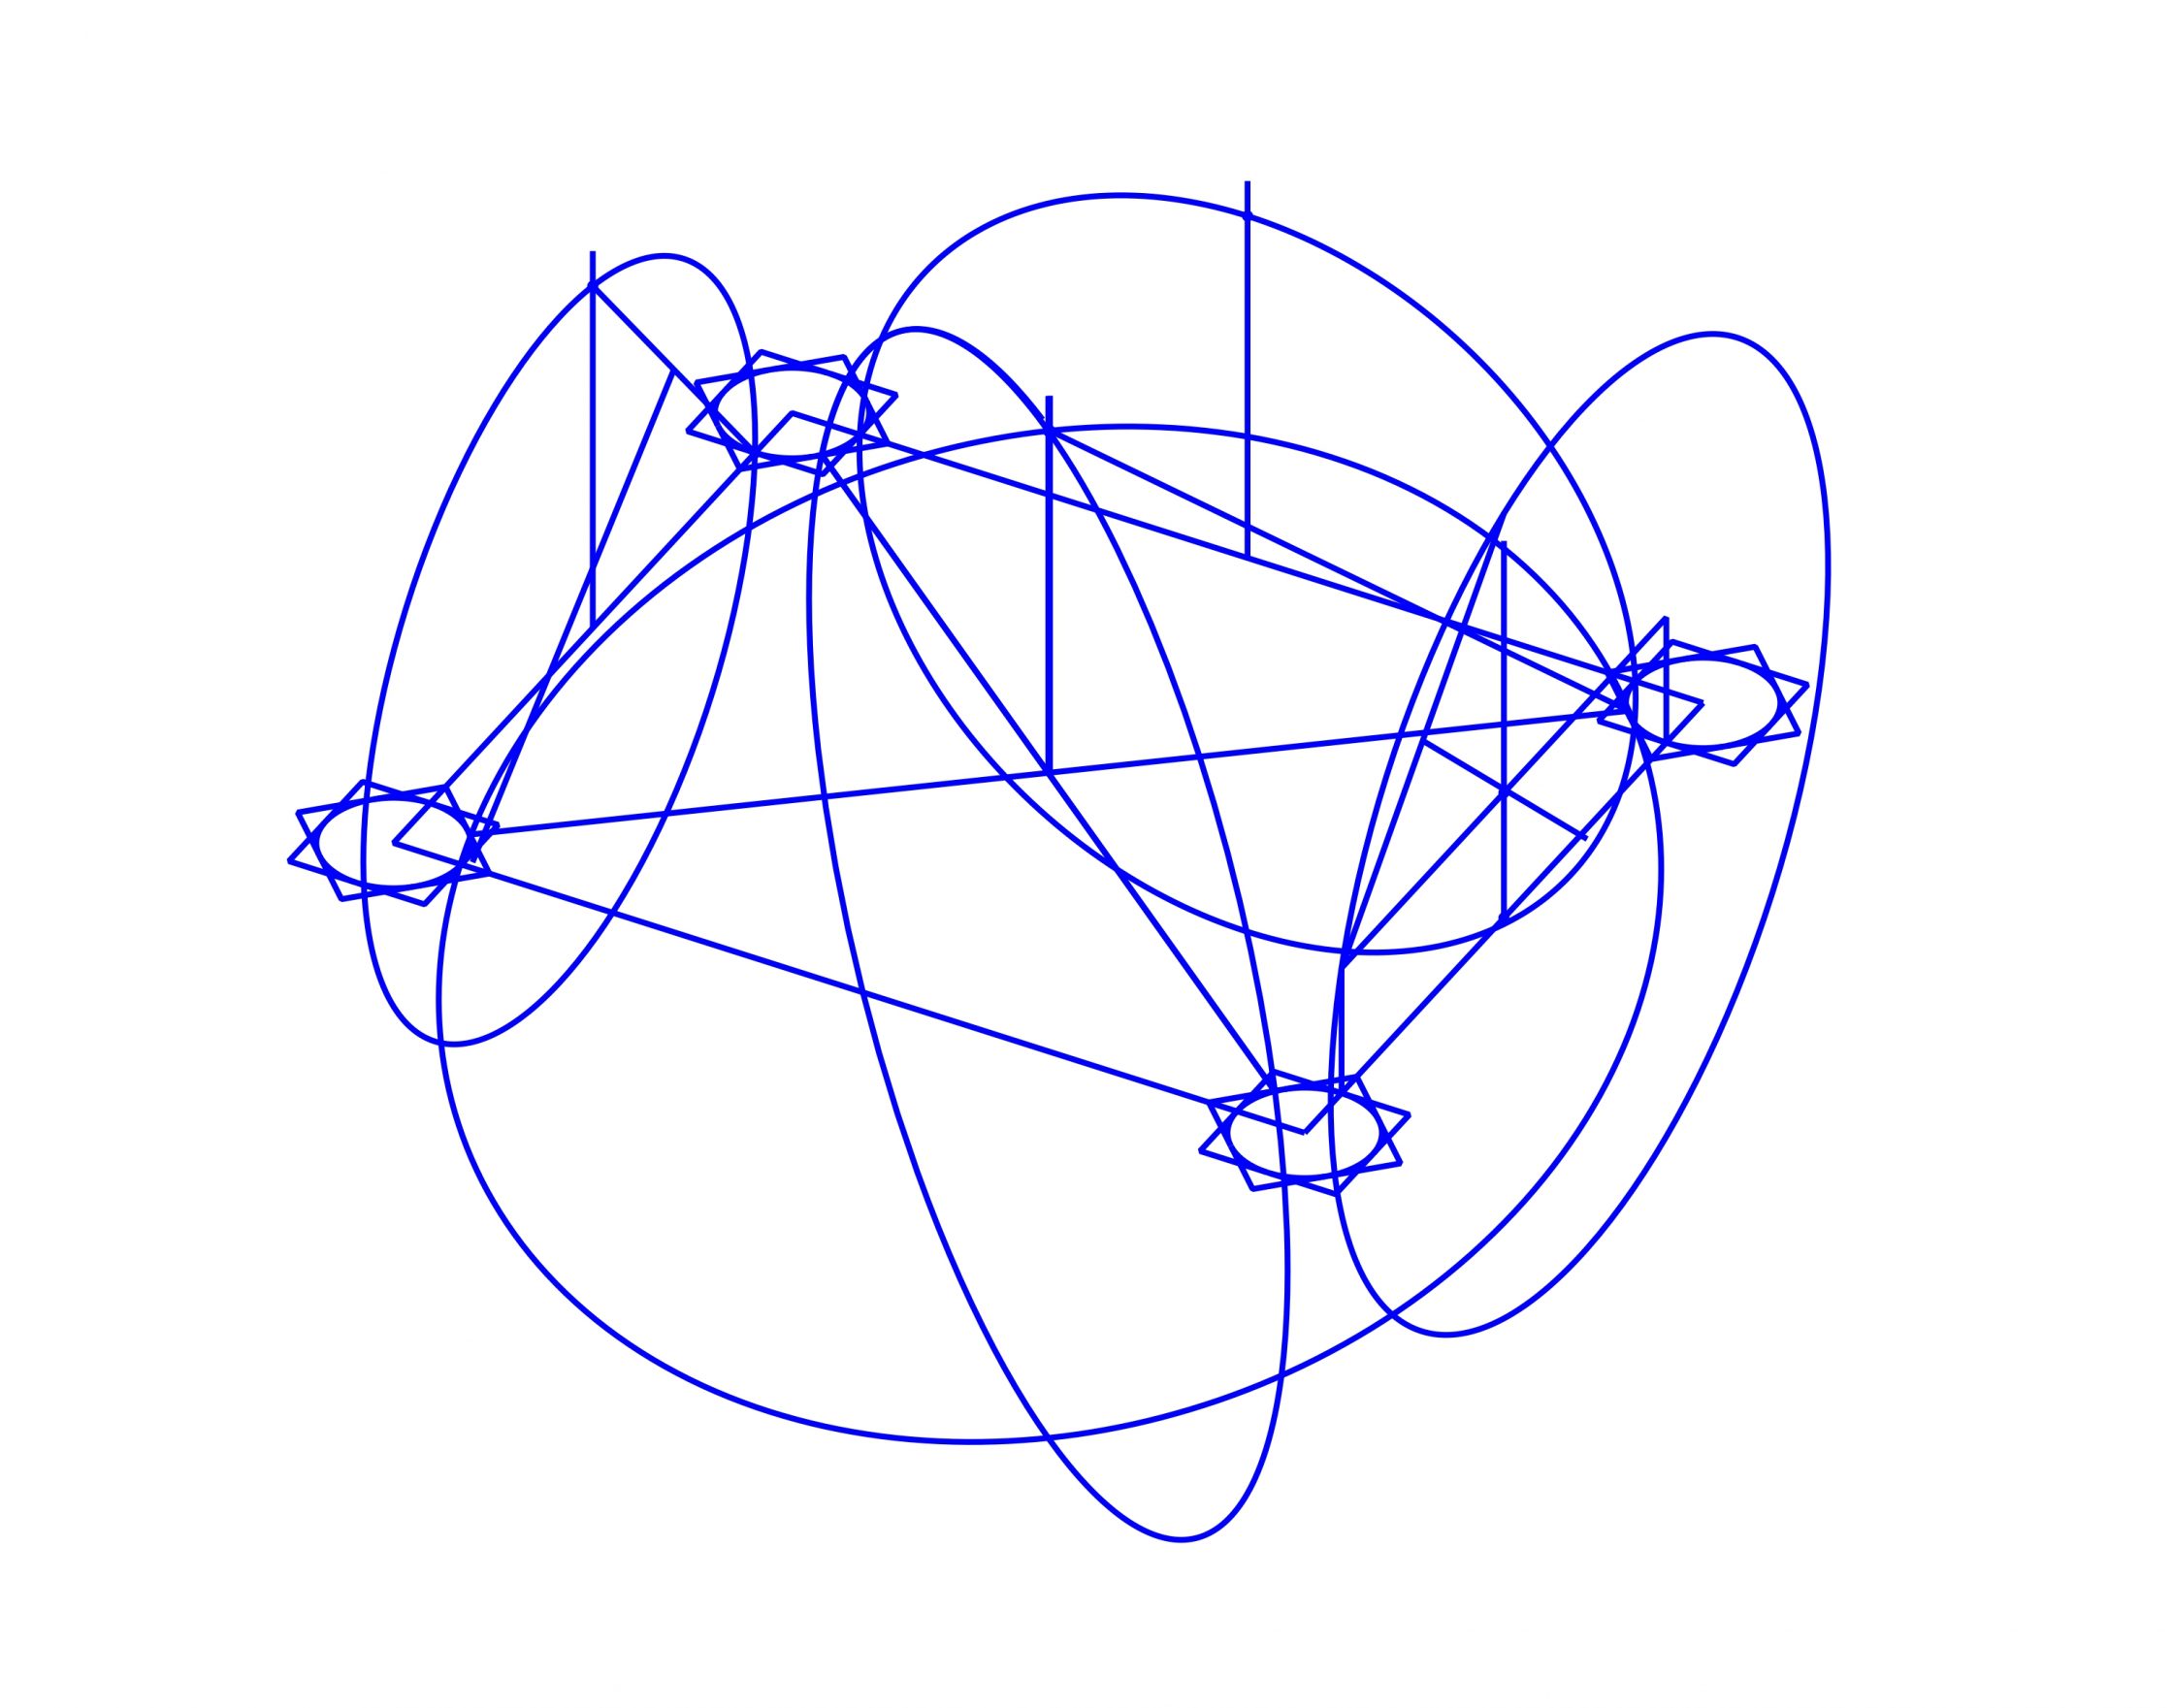
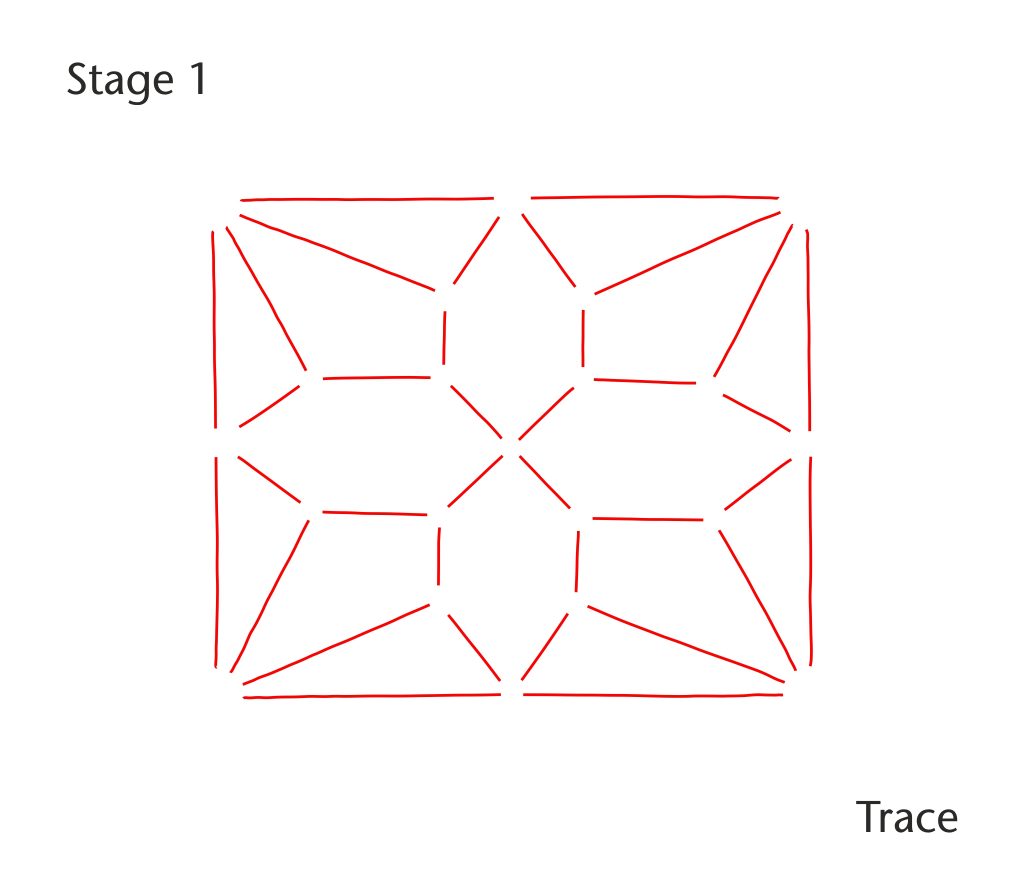
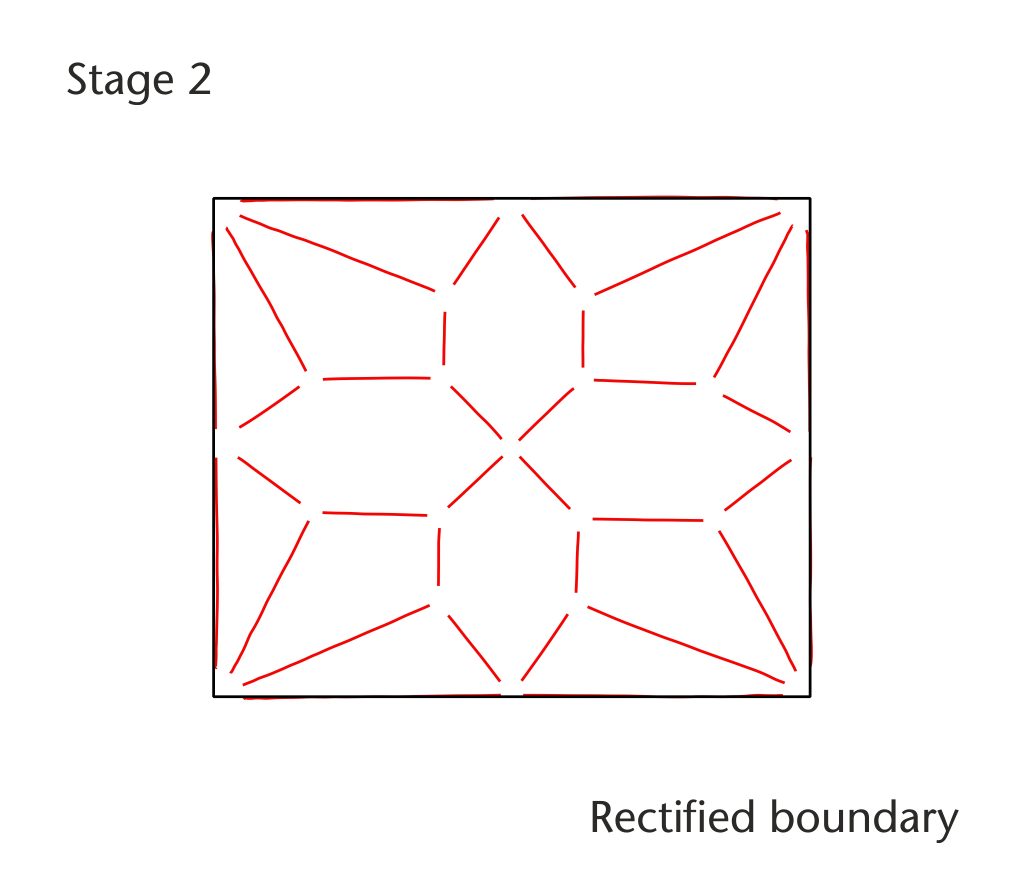
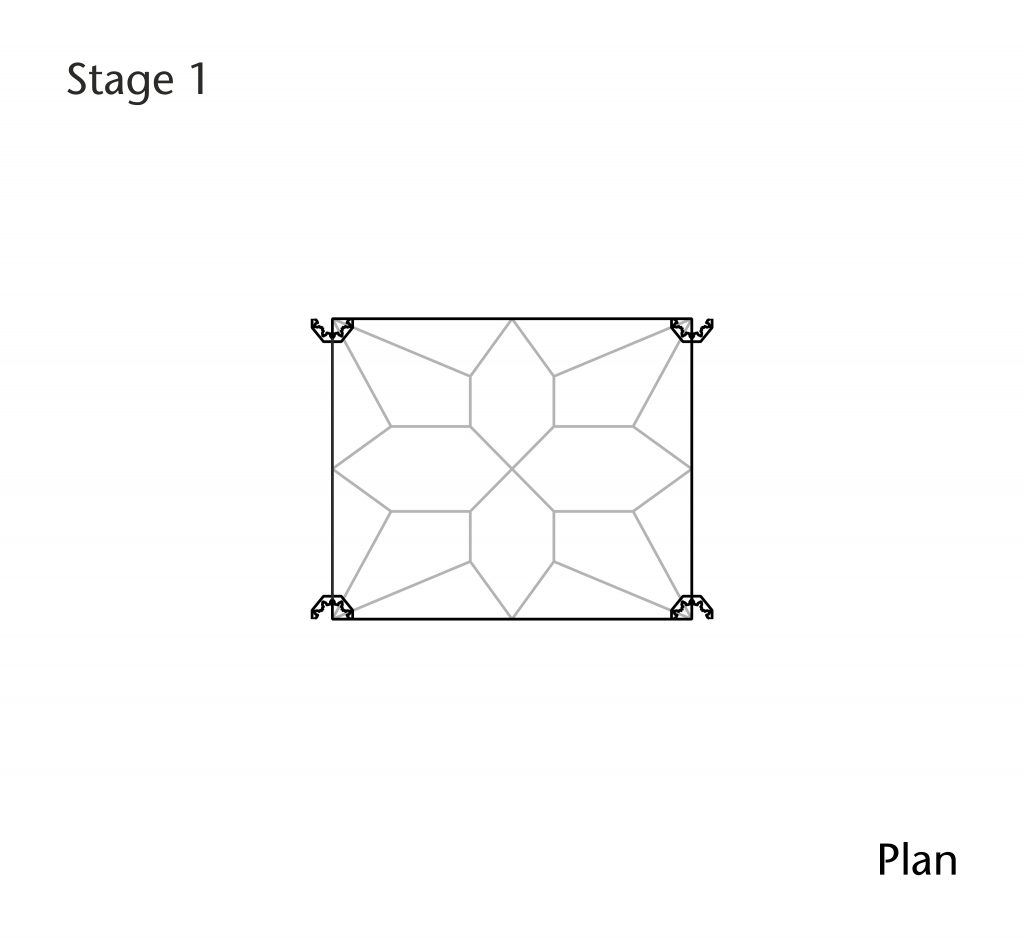
For the vault plan, the focal point for the analysis is the traced intrados lines. These are flattened into a top down plan and exported into Microstation, a 2D CAD software platform. Measurements of the plan’s boundaries are made and compared to a variety of different proportional systems. If a match is found, the actual vault plan is overlaid onto a rectified version of the bay’s dimensions. This diagram is then used to impose a series of different geometrical figures onto the surface of the plan, starting with the simplest and steadily escalating to more complex methods as is required. In each case the points of intersection between the ribs are identified and compared to those which could be generated by employing a particular geometrical method. If no match is found, then an alternative figure is tried, the analysis proceeding iteratively until the best match for each rib is found.
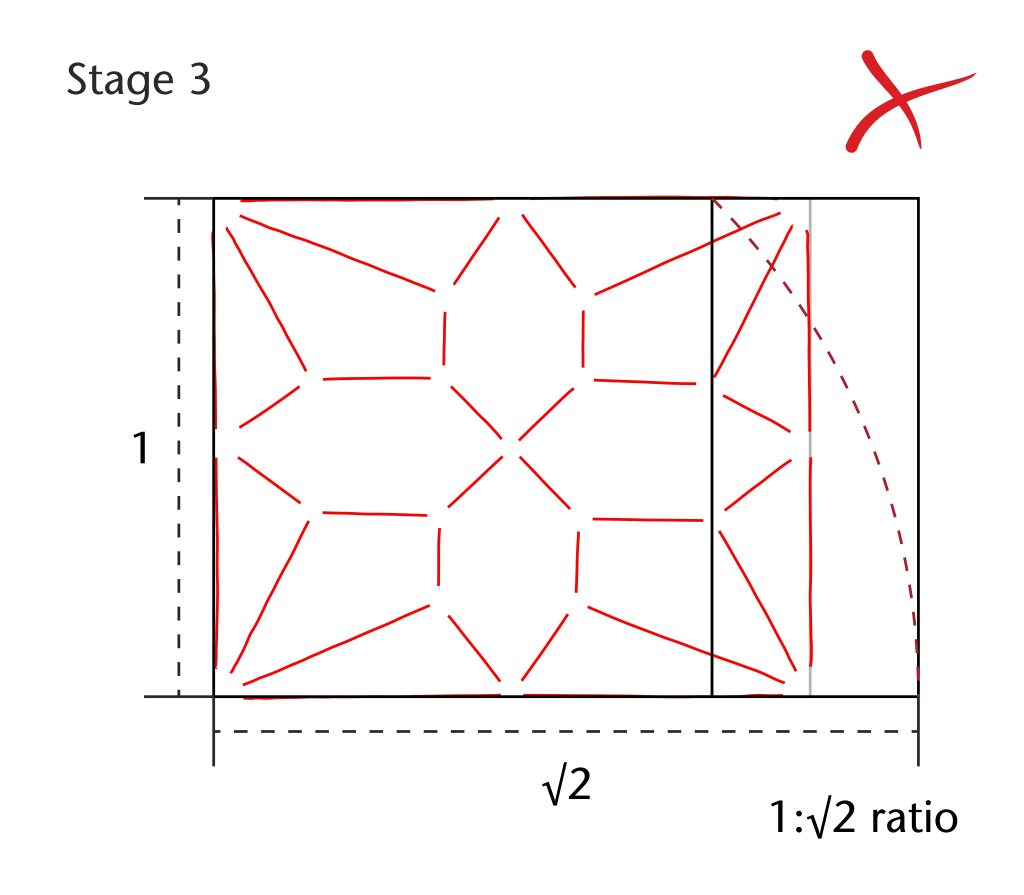
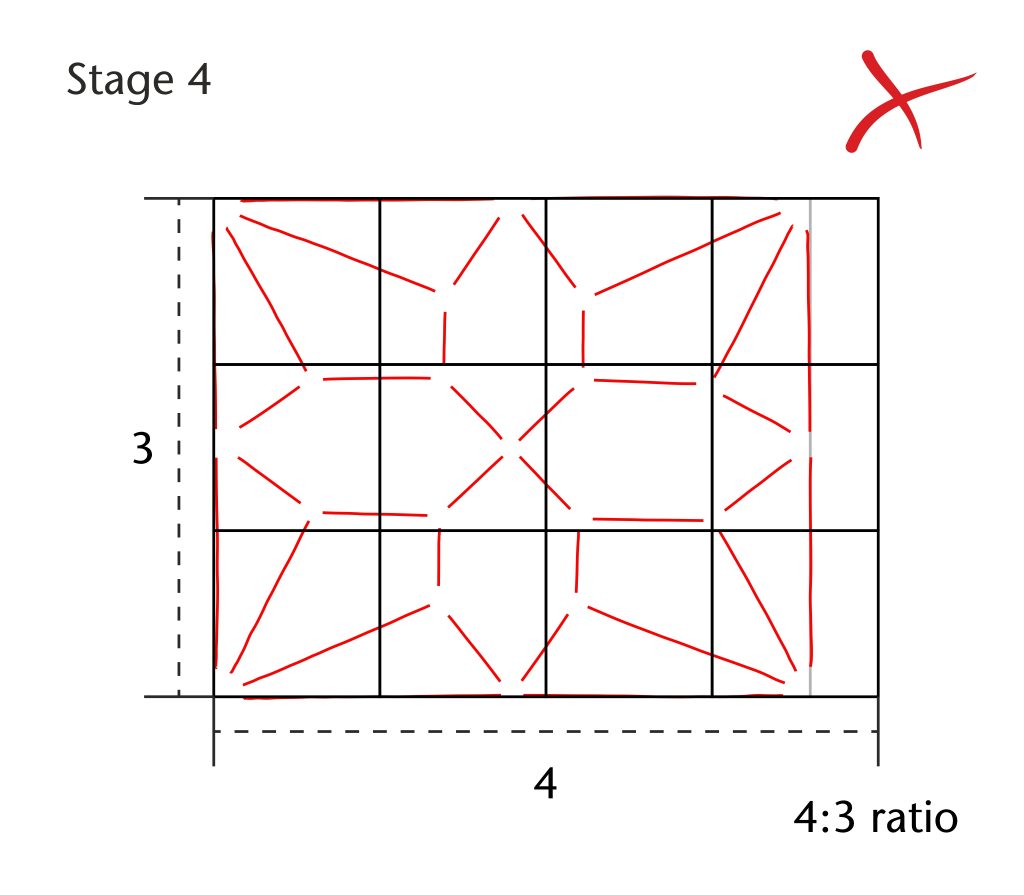
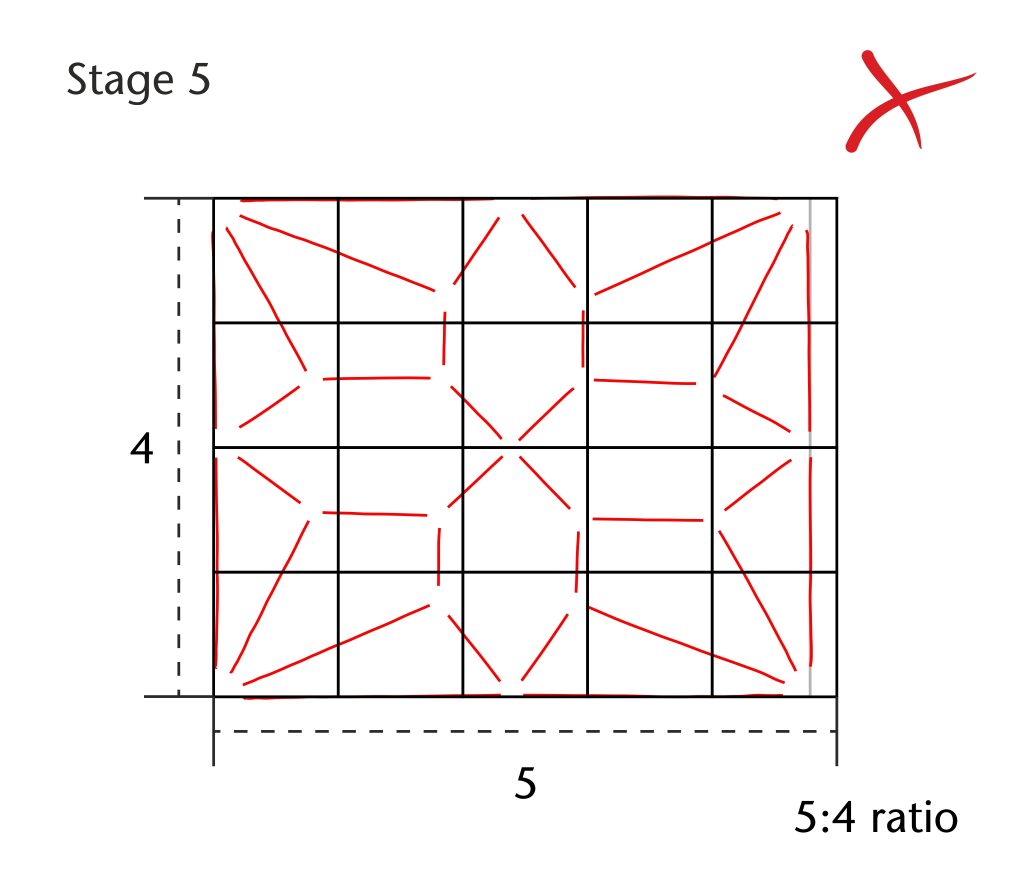
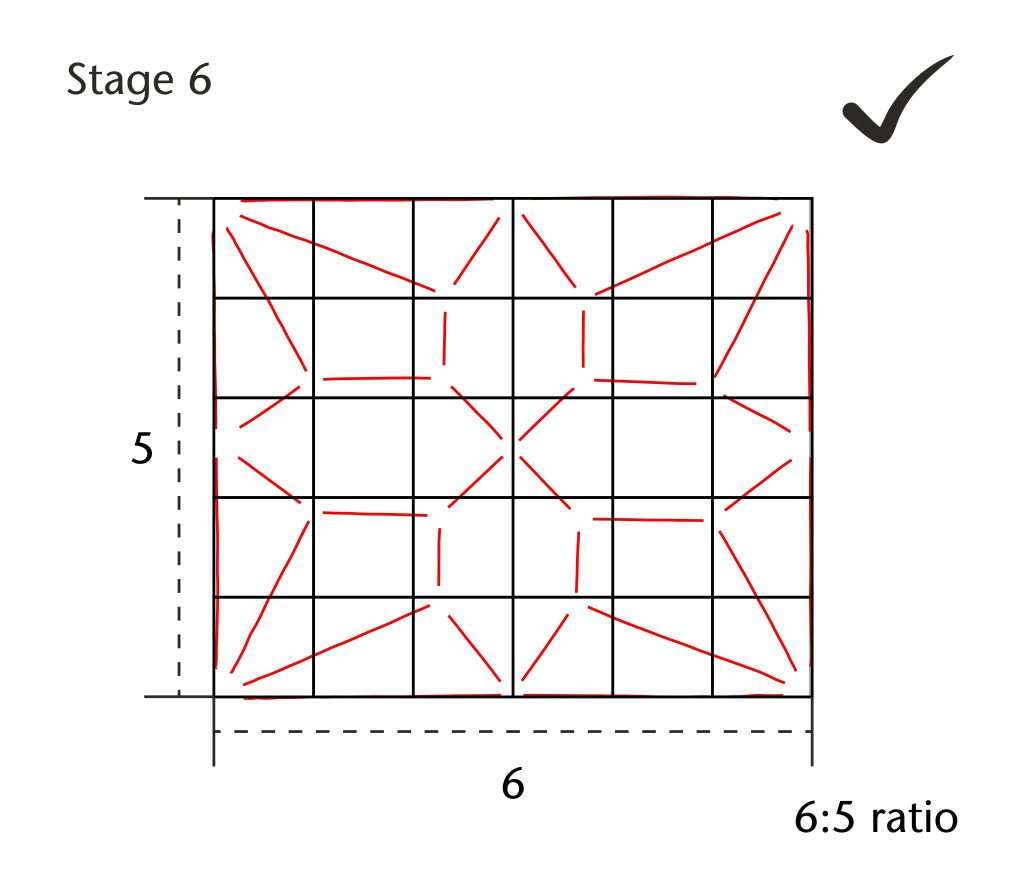
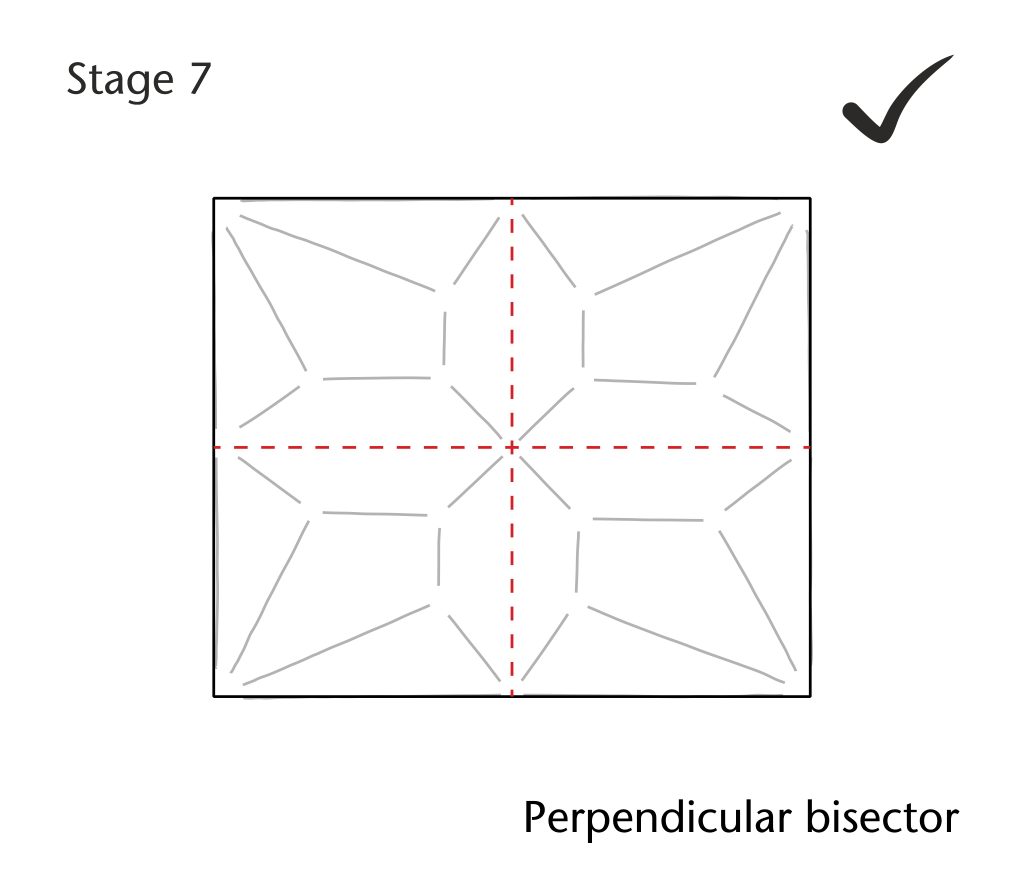
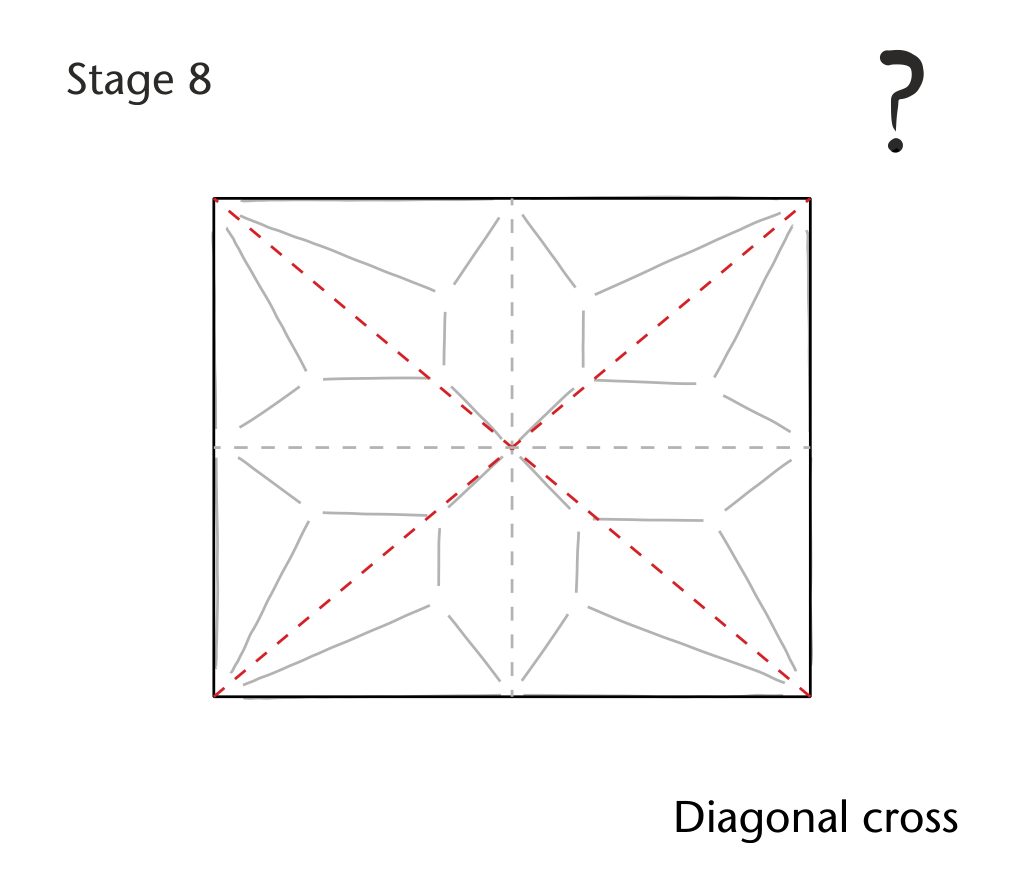
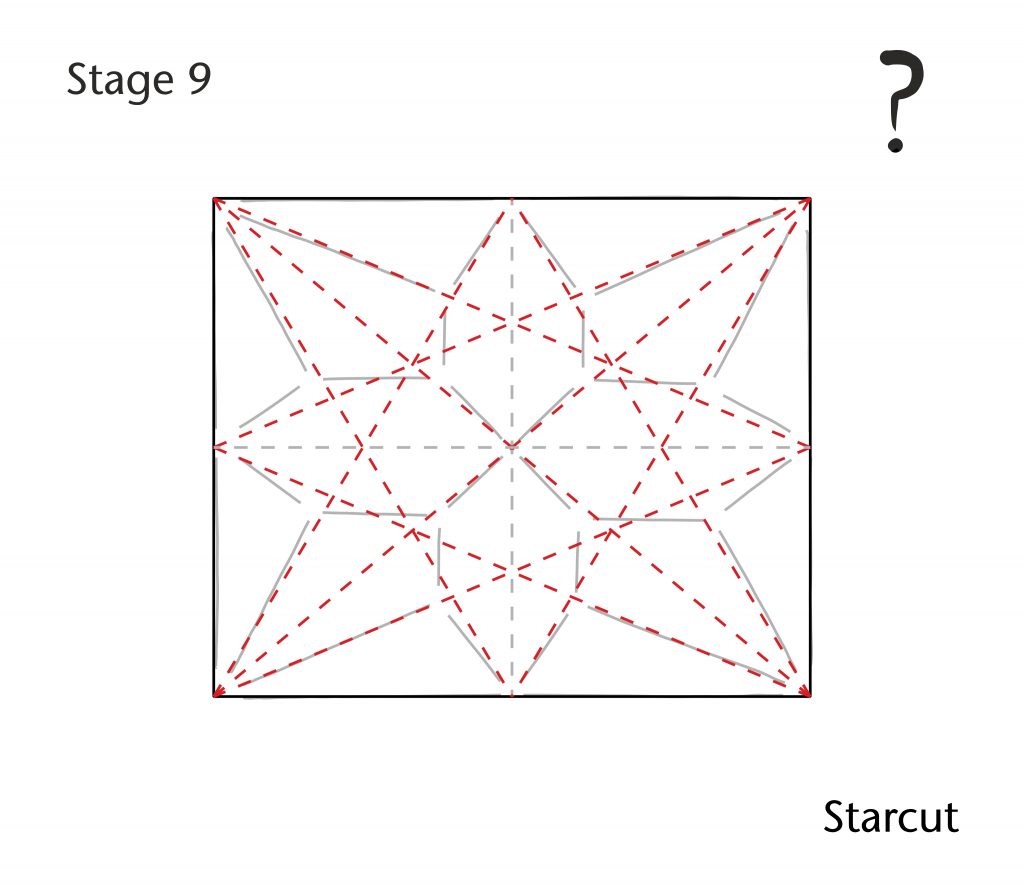
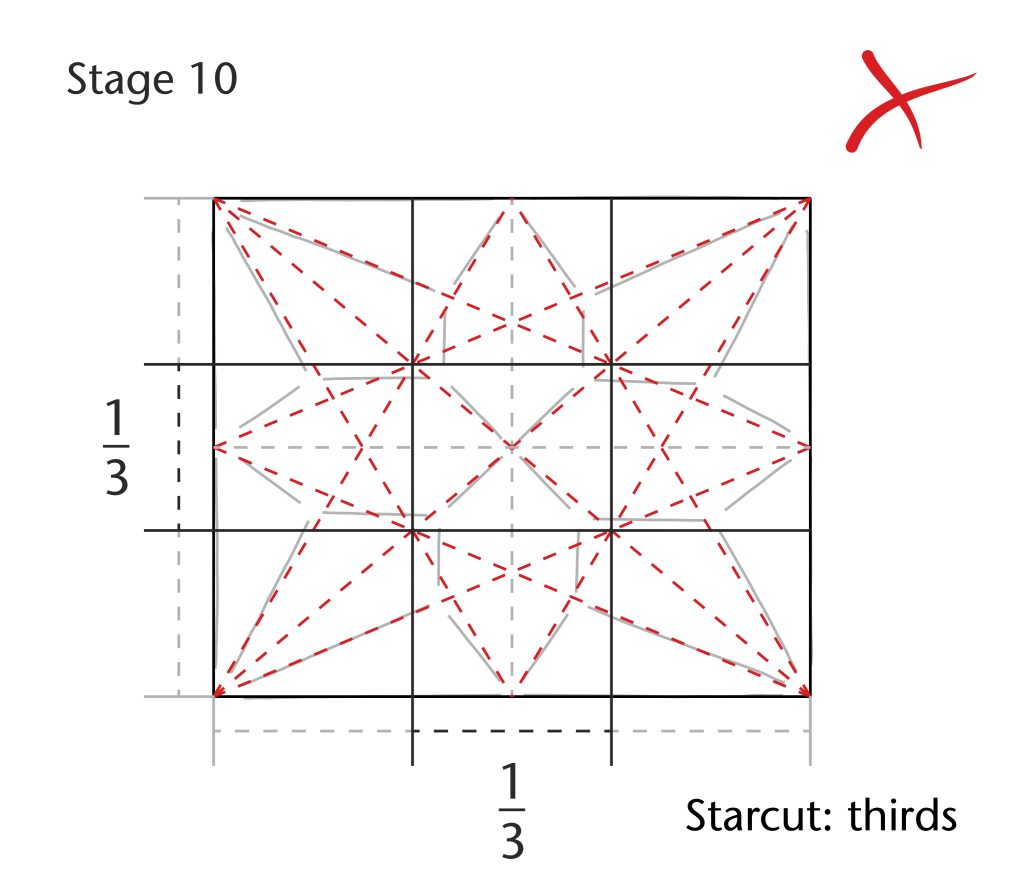
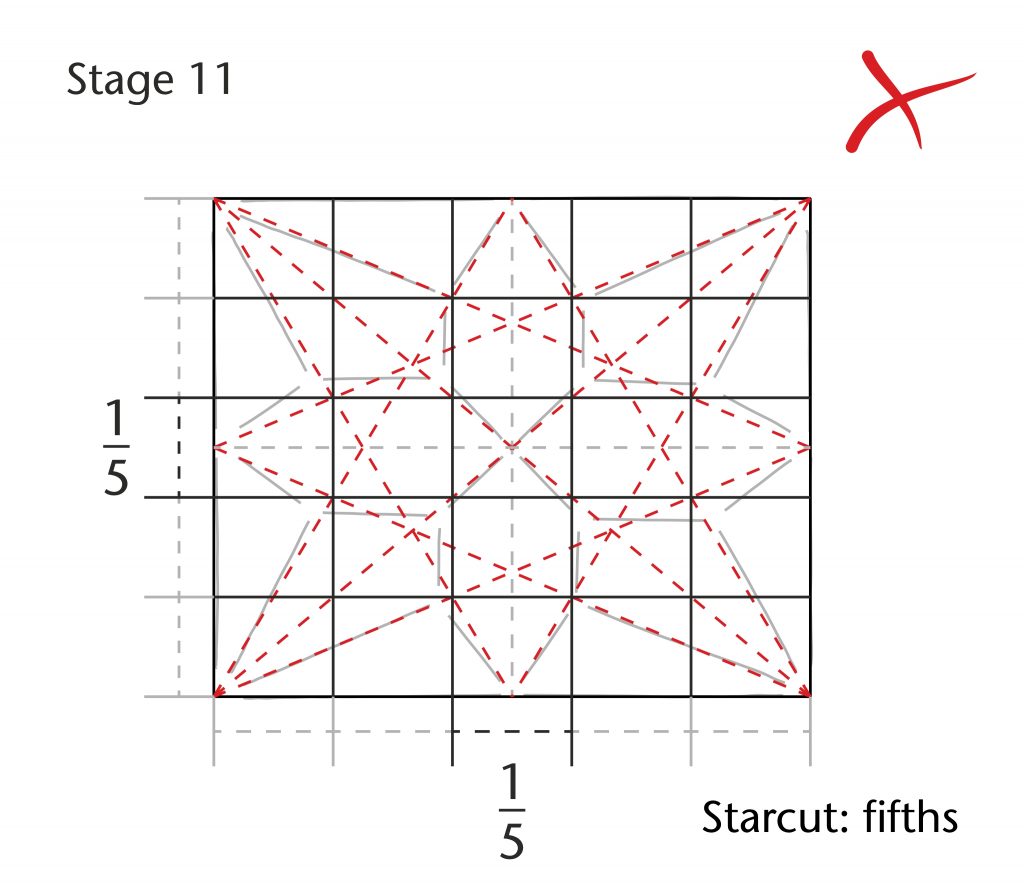
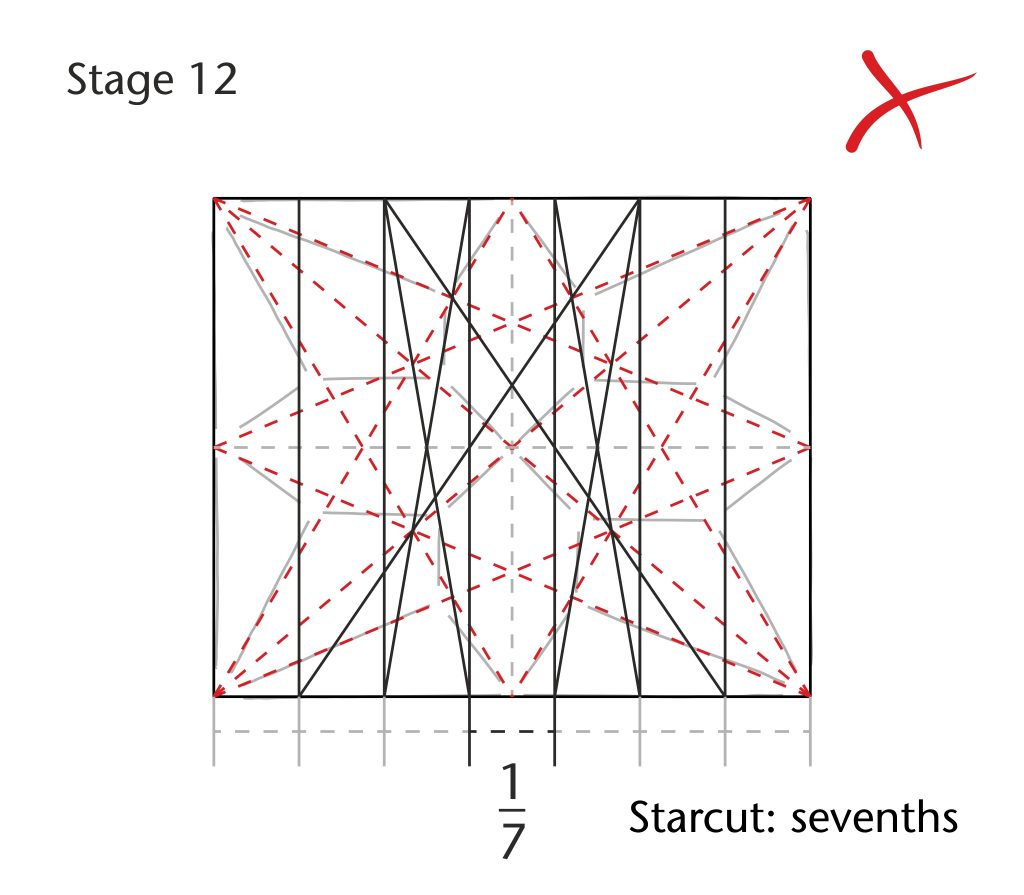
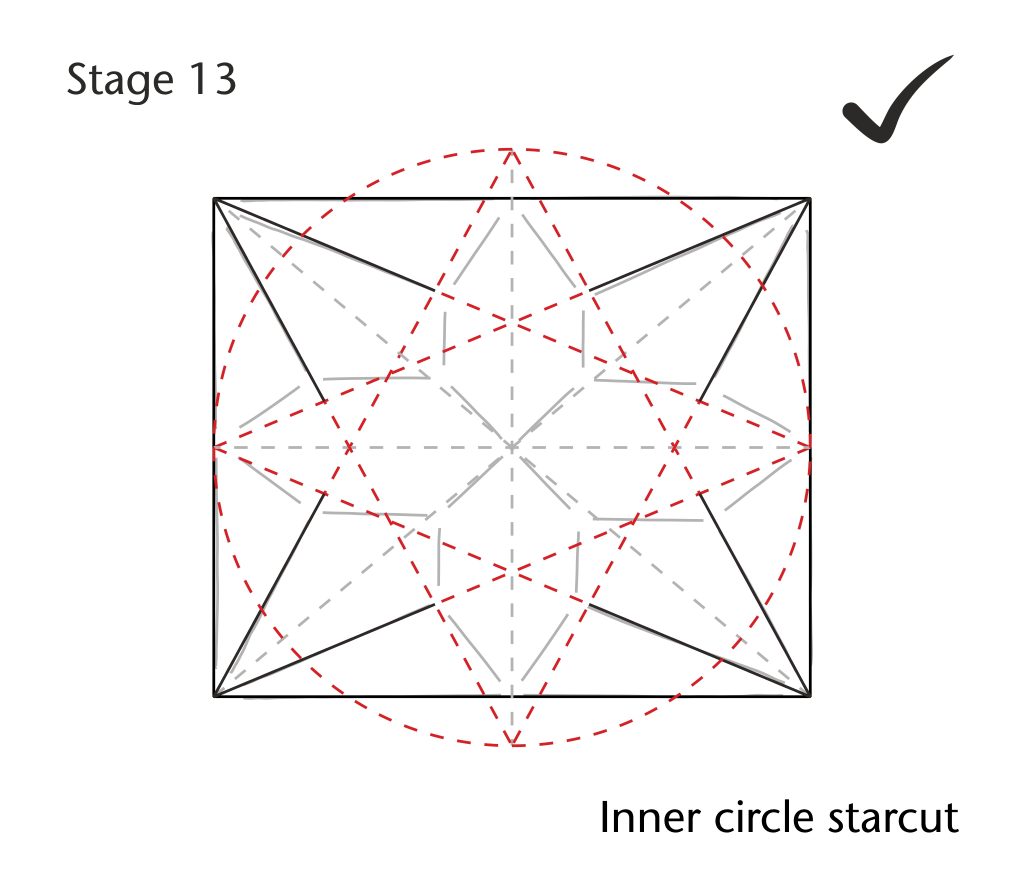
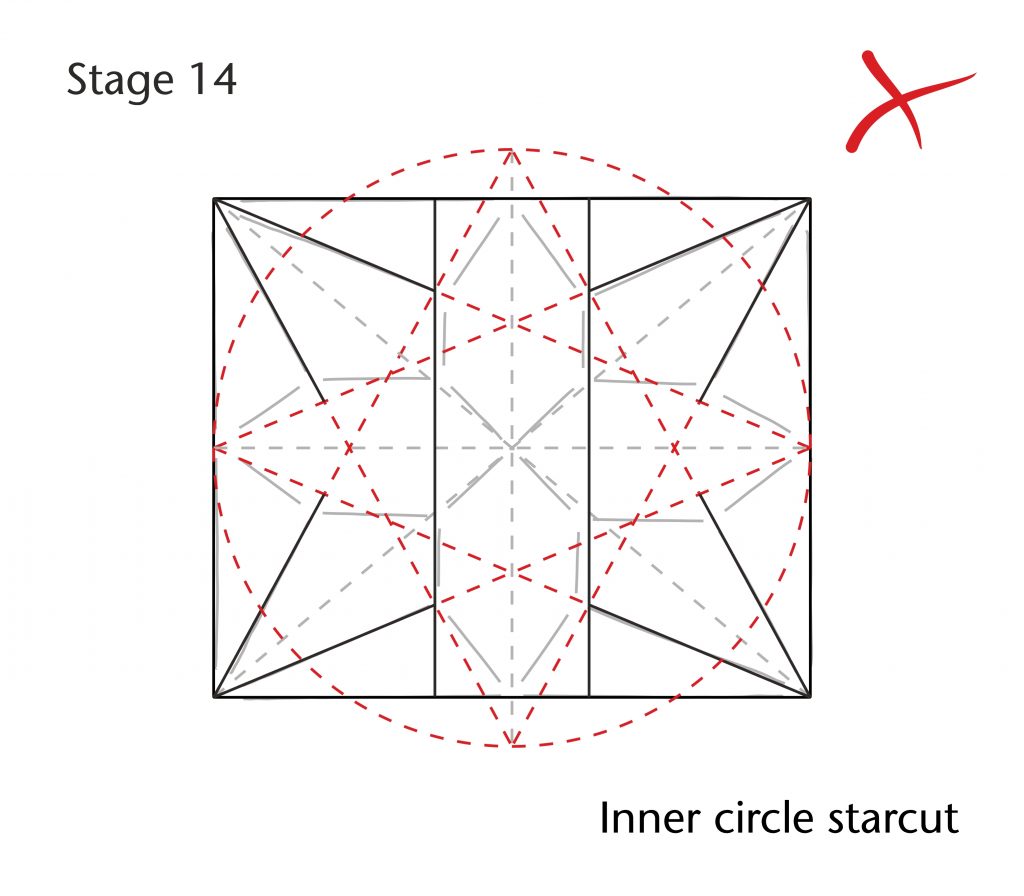
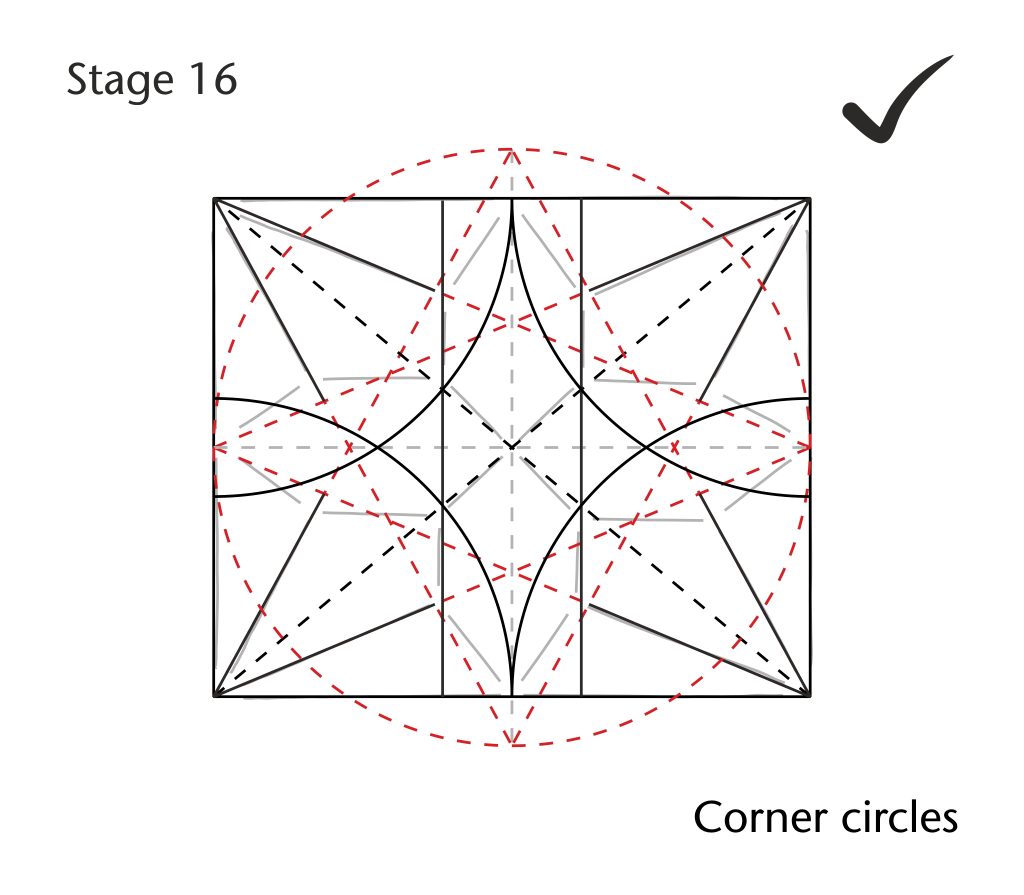
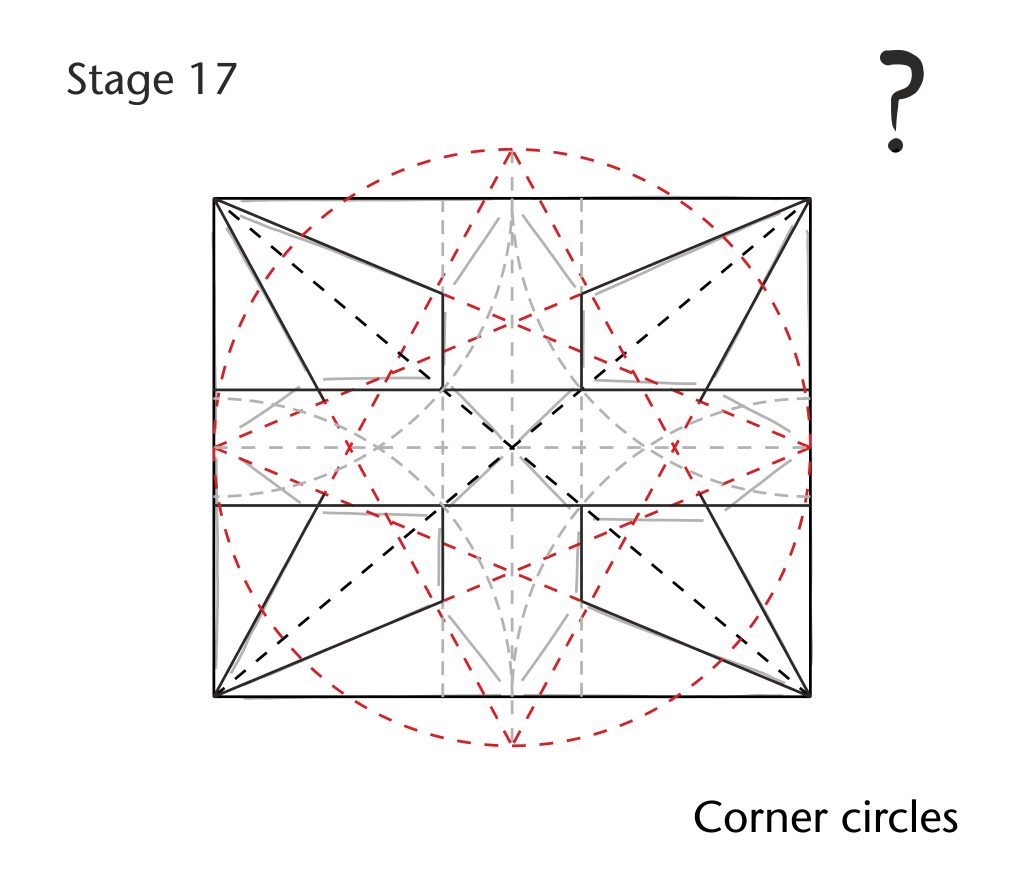
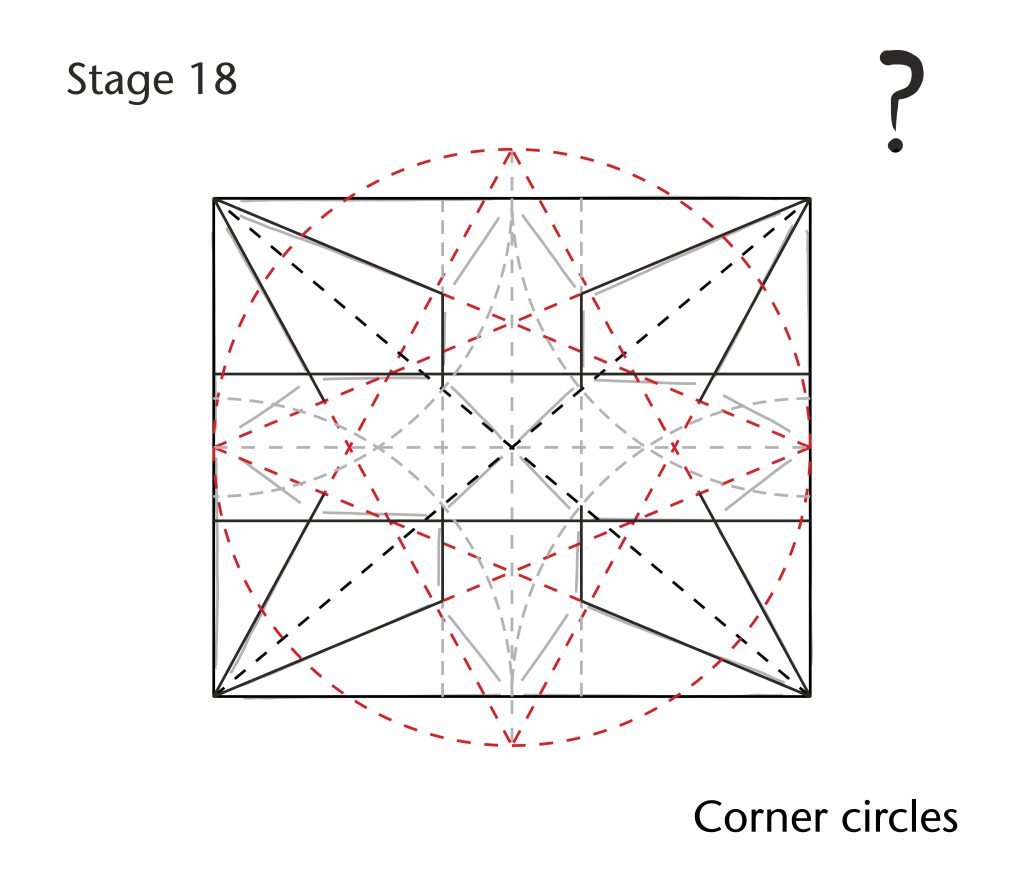
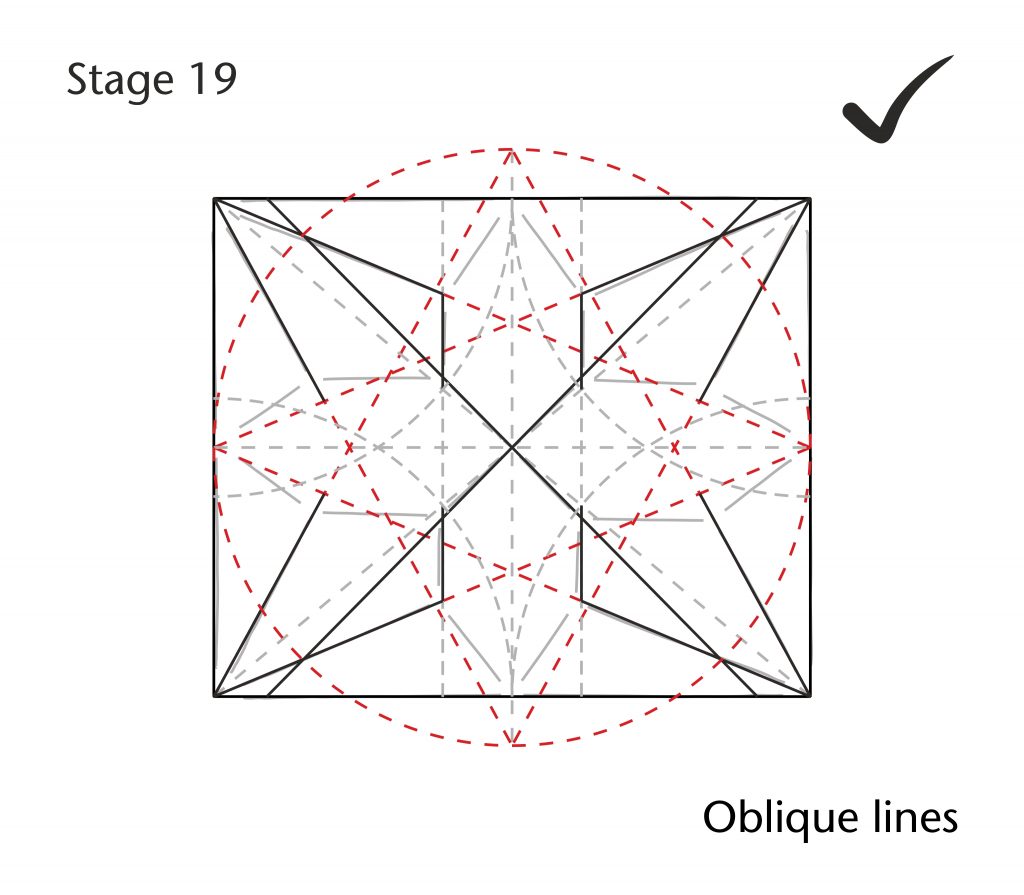
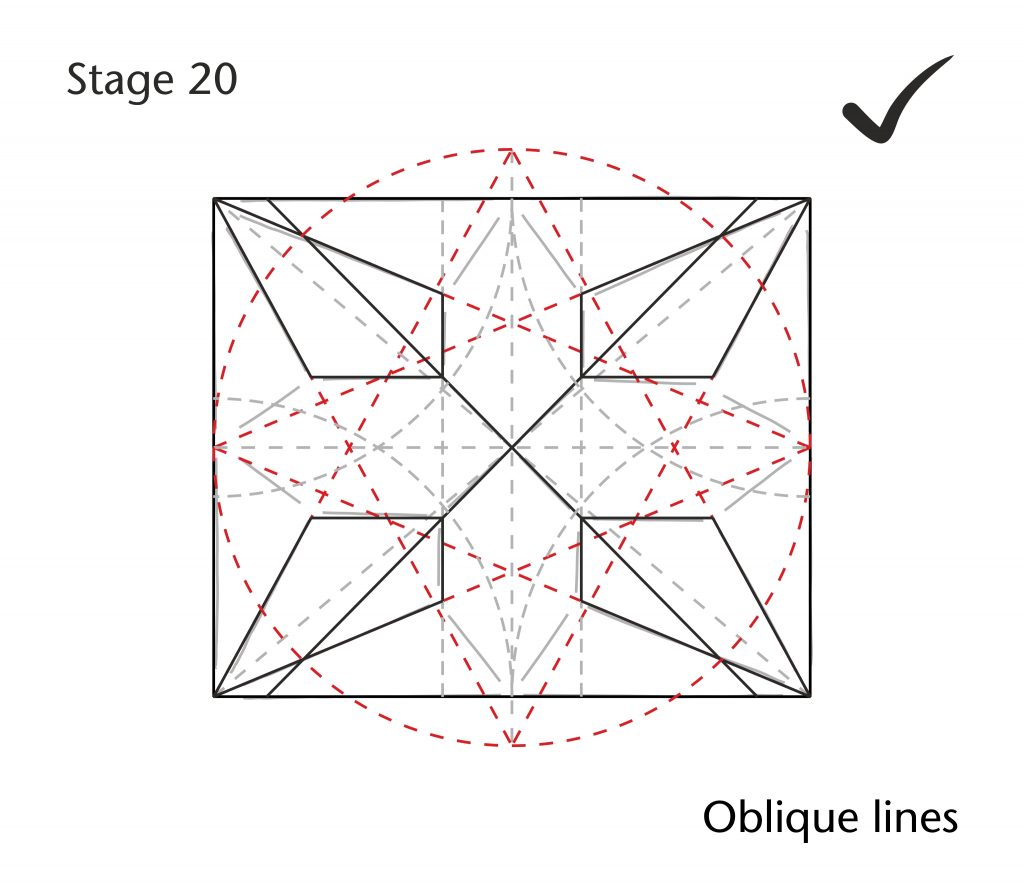
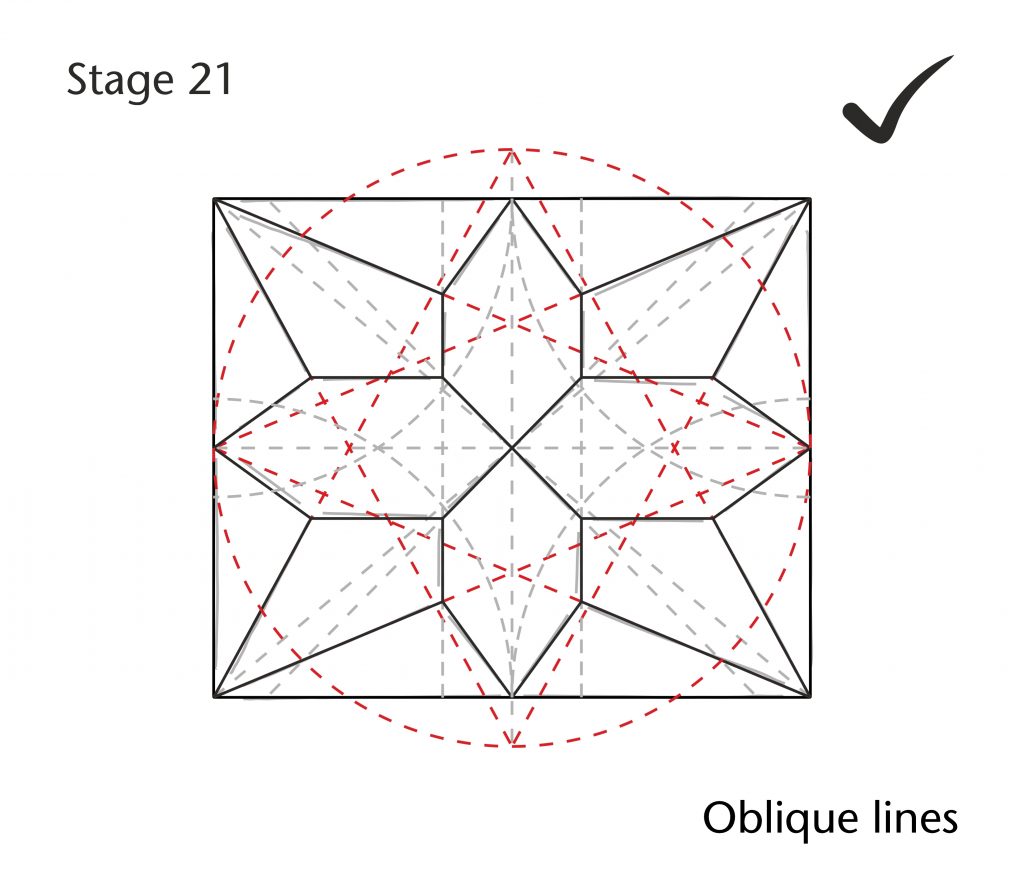
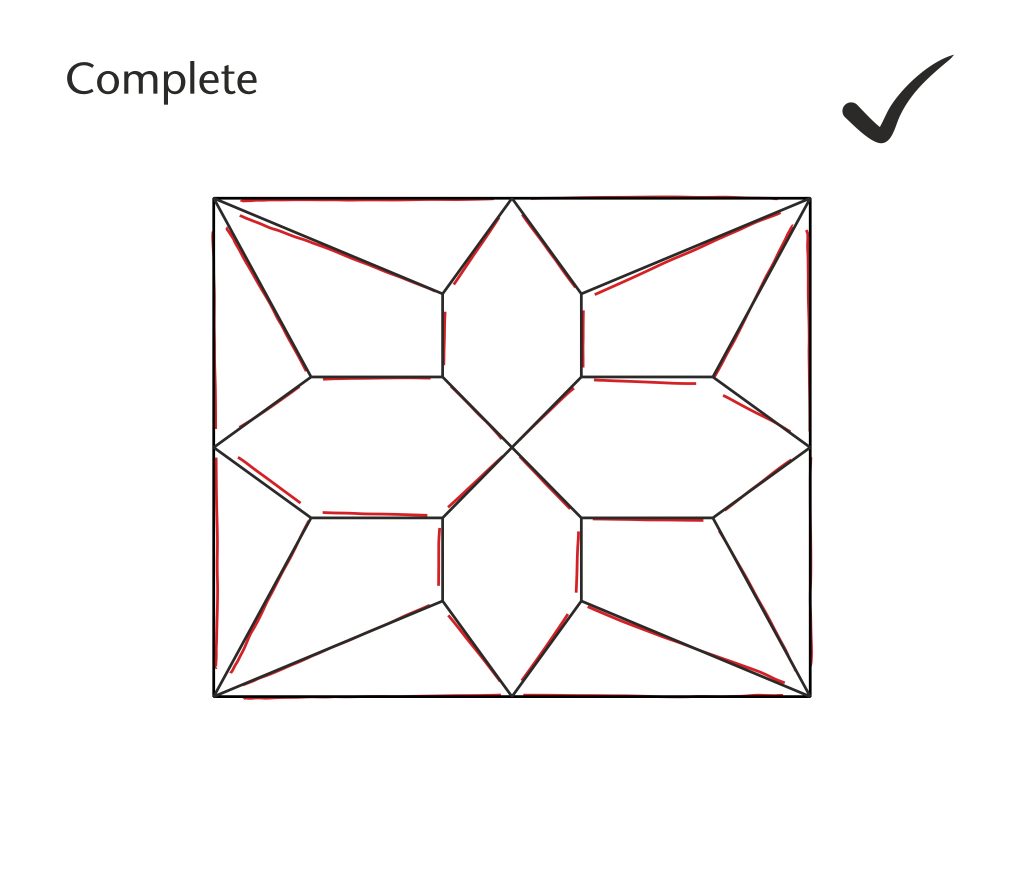
For bay N5 of the north choir aisle at Wells Cathedral we tried several different proportional systems for the layout of the bay plan. The closest match we found was a modular length-to-width ratio of 6:5. We then tried a number of geometrical methods for setting out the ribs. The first which we used was the starcut, a key geometrical figure within medieval vault design which can be used to divide the bay plan into any number of equal fractions. Whilst this has been found in vaults at a number of our sites, it did not provide a good match for the angles of the ribs or position of the bosses in bay N5 at Wells. However, a variation on this technique which we call the inner circle starcut was more successful, so we began to experiment with alternative methods of constructing the pattern of ribs using this figure. We continued to try different methods until we had reached the closest match that we could find, giving us a provisional hypothesis for how the vault plan could have been set out.
Rib curvatures
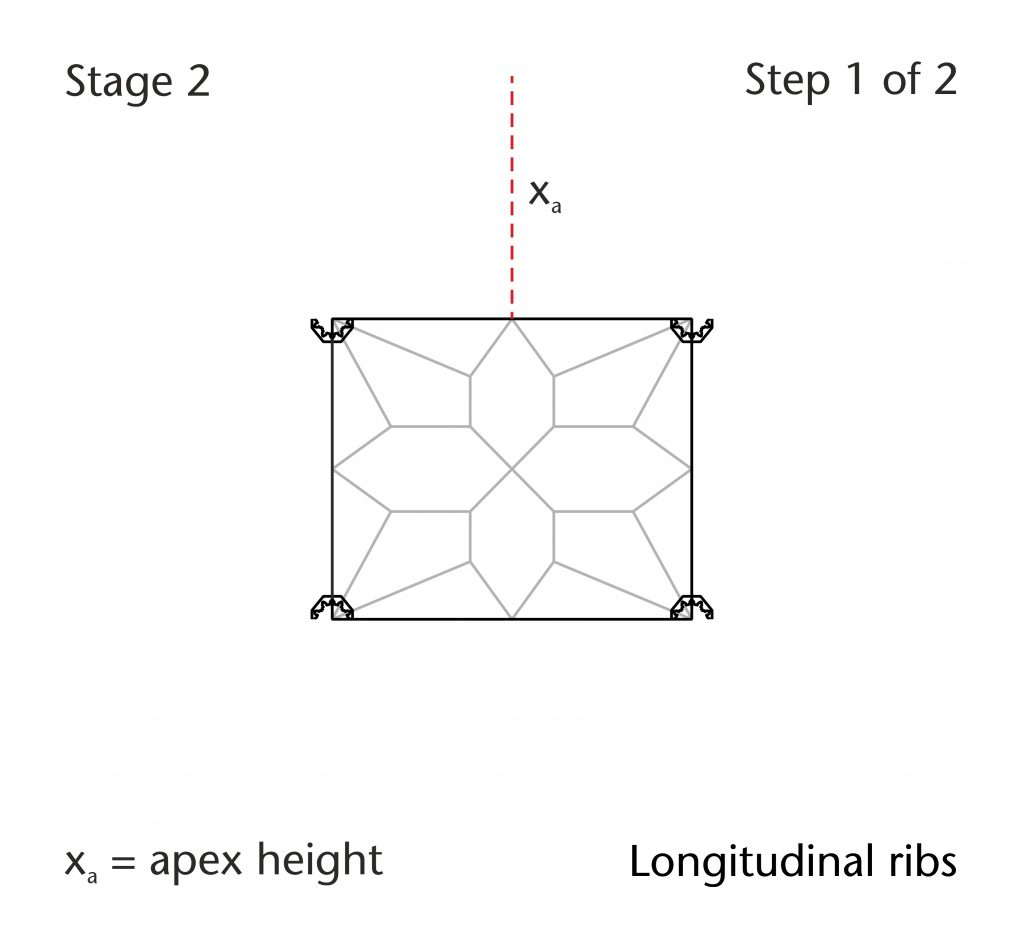
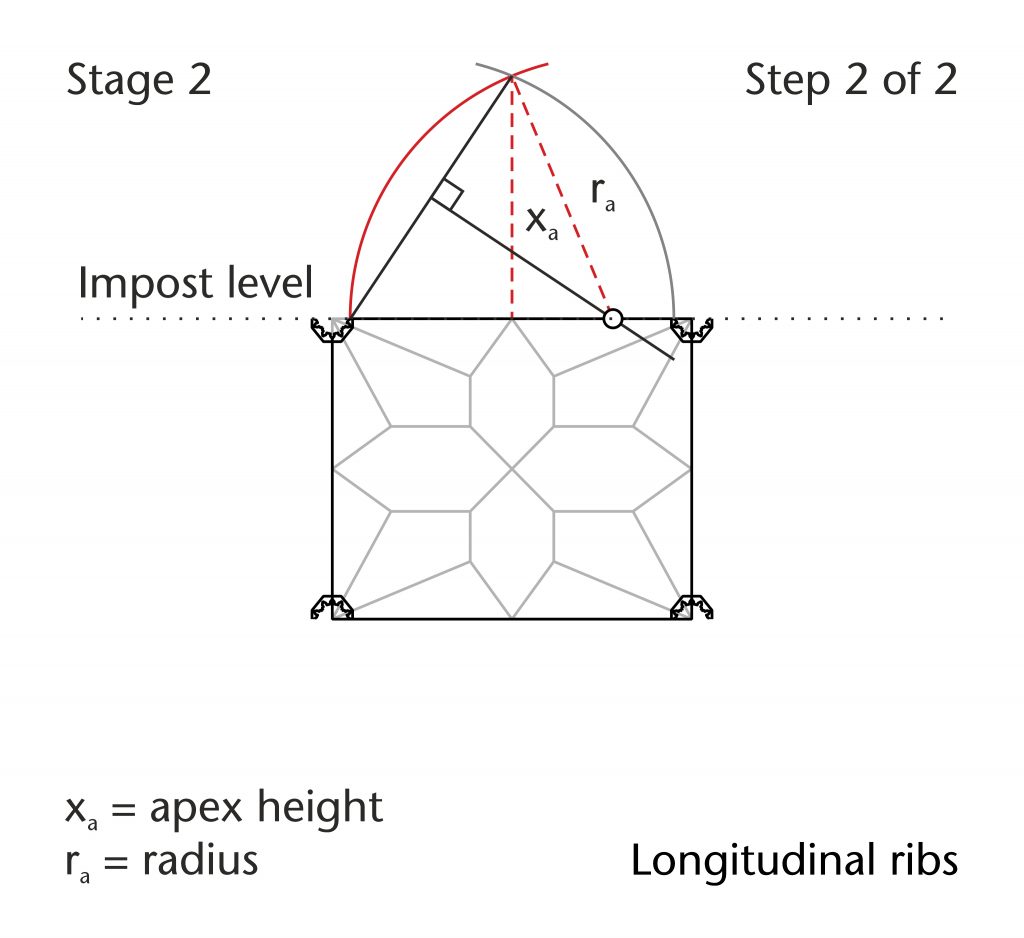
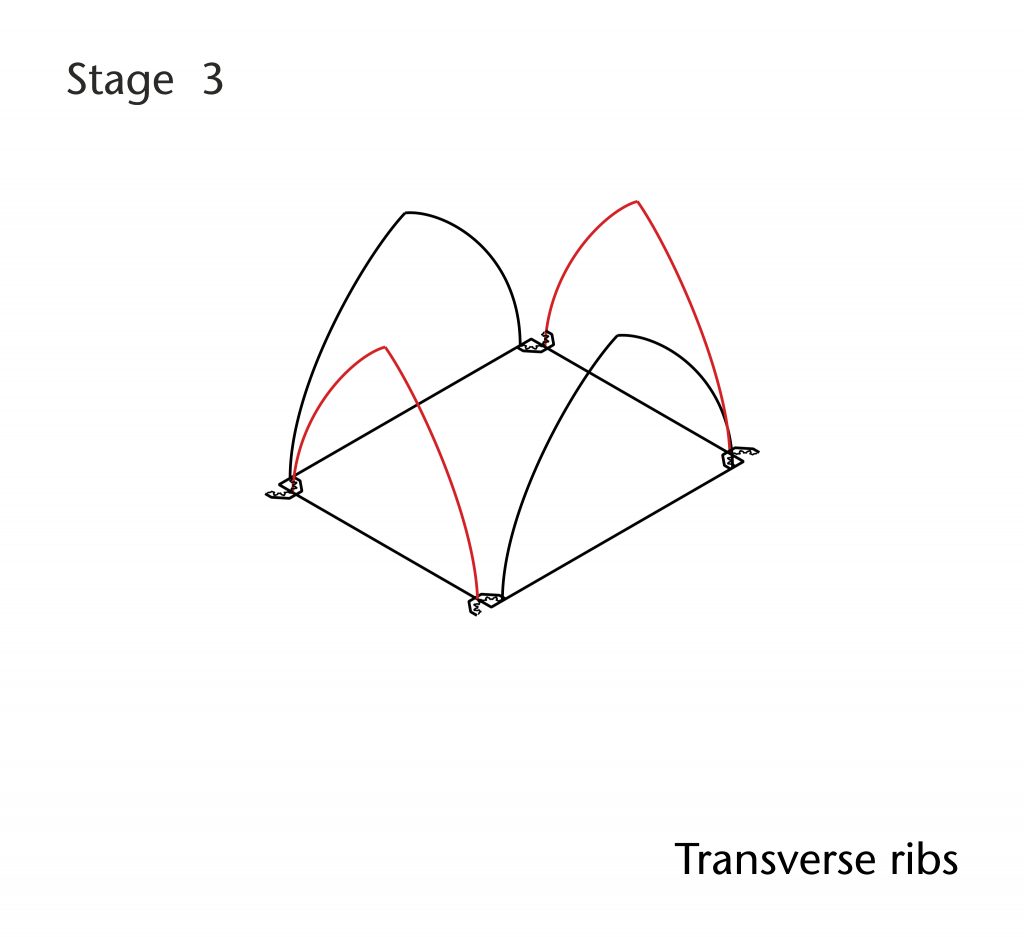
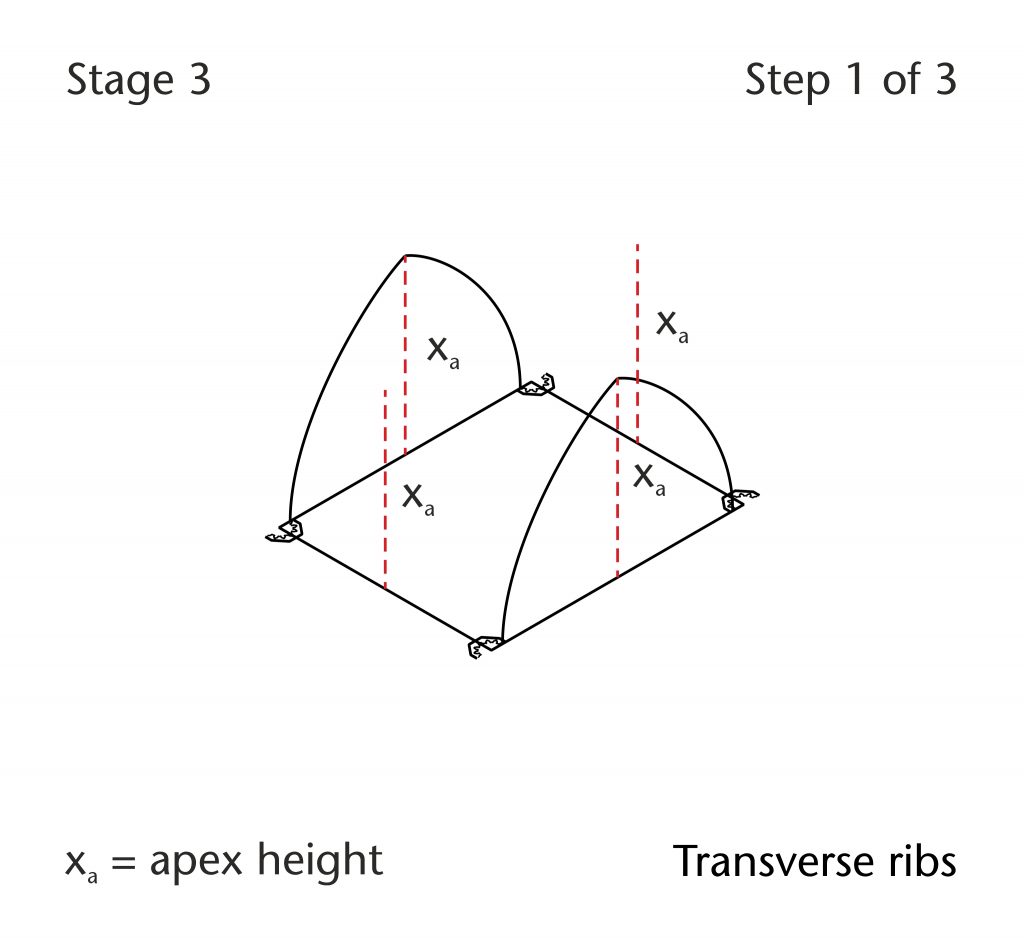
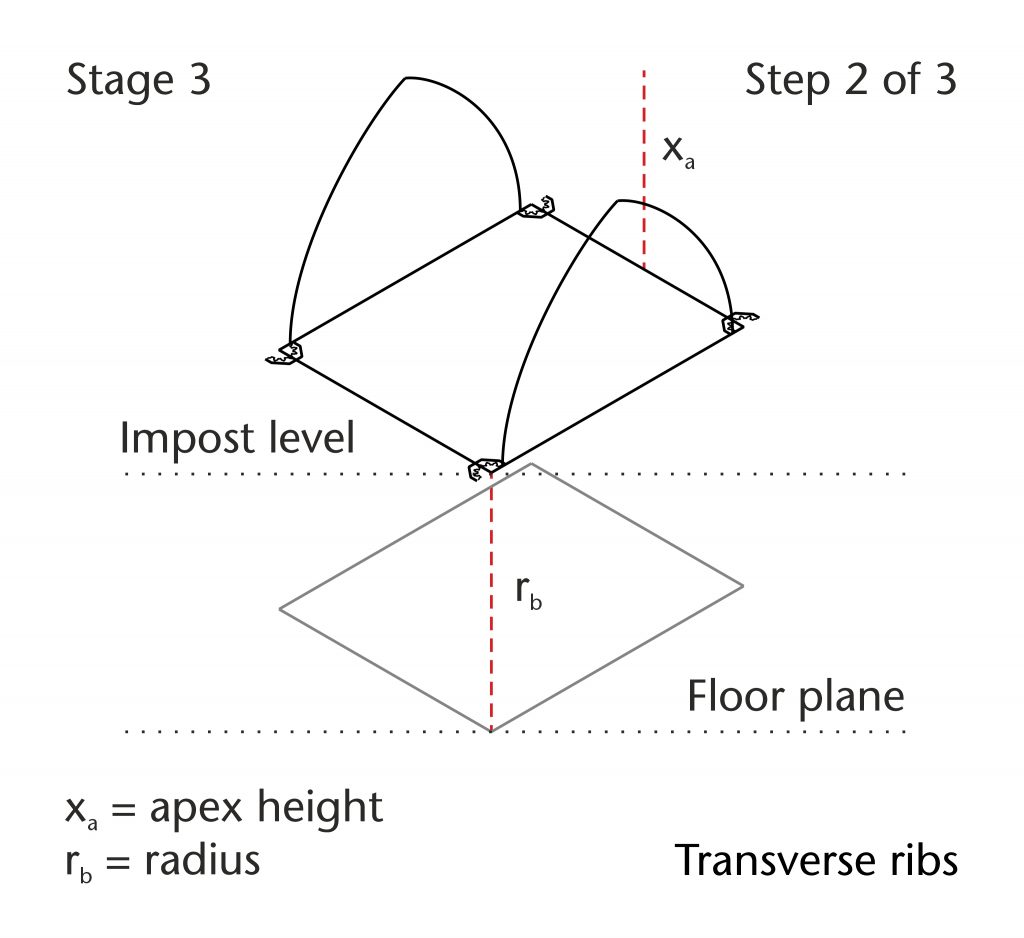
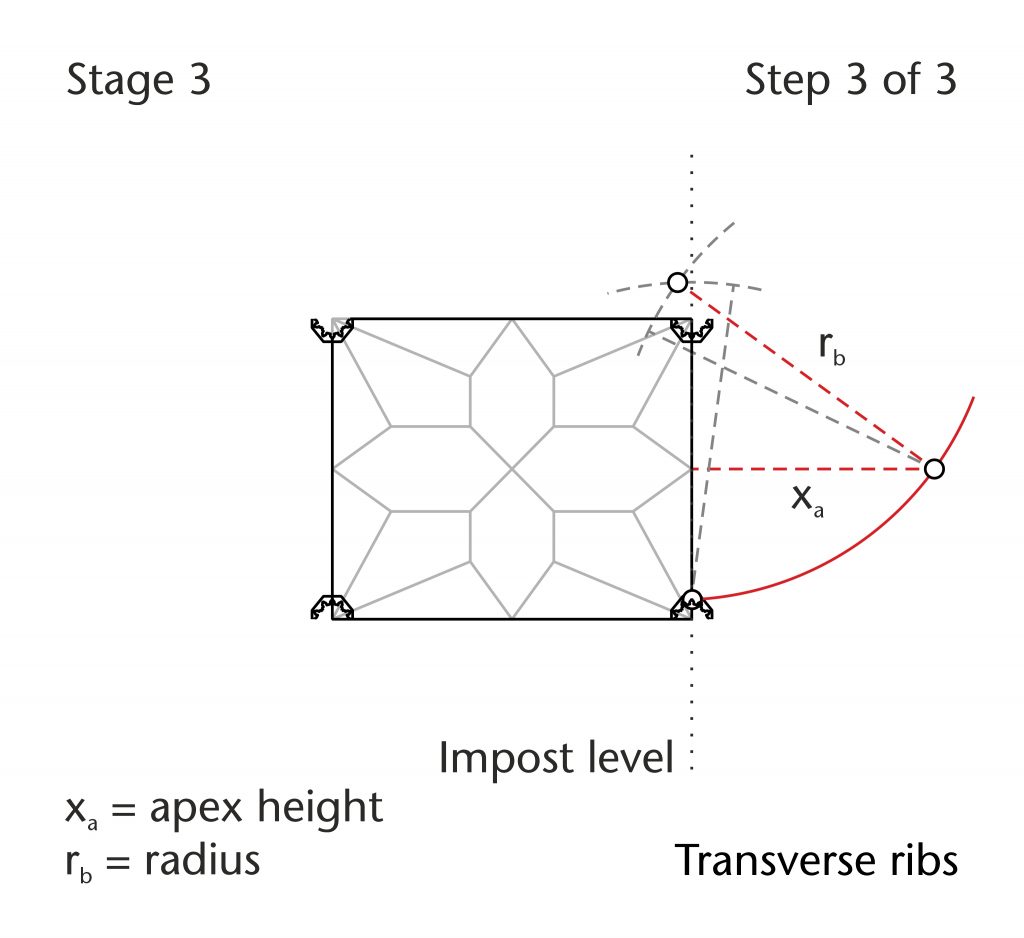
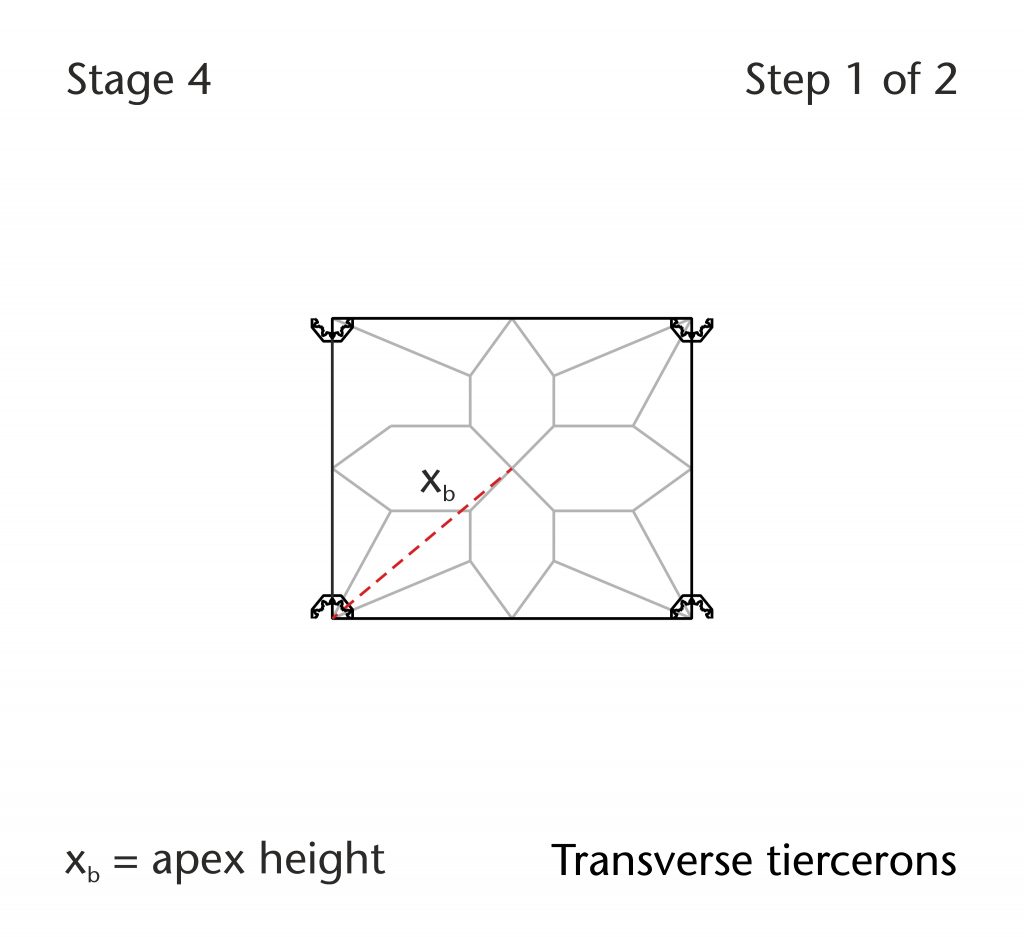
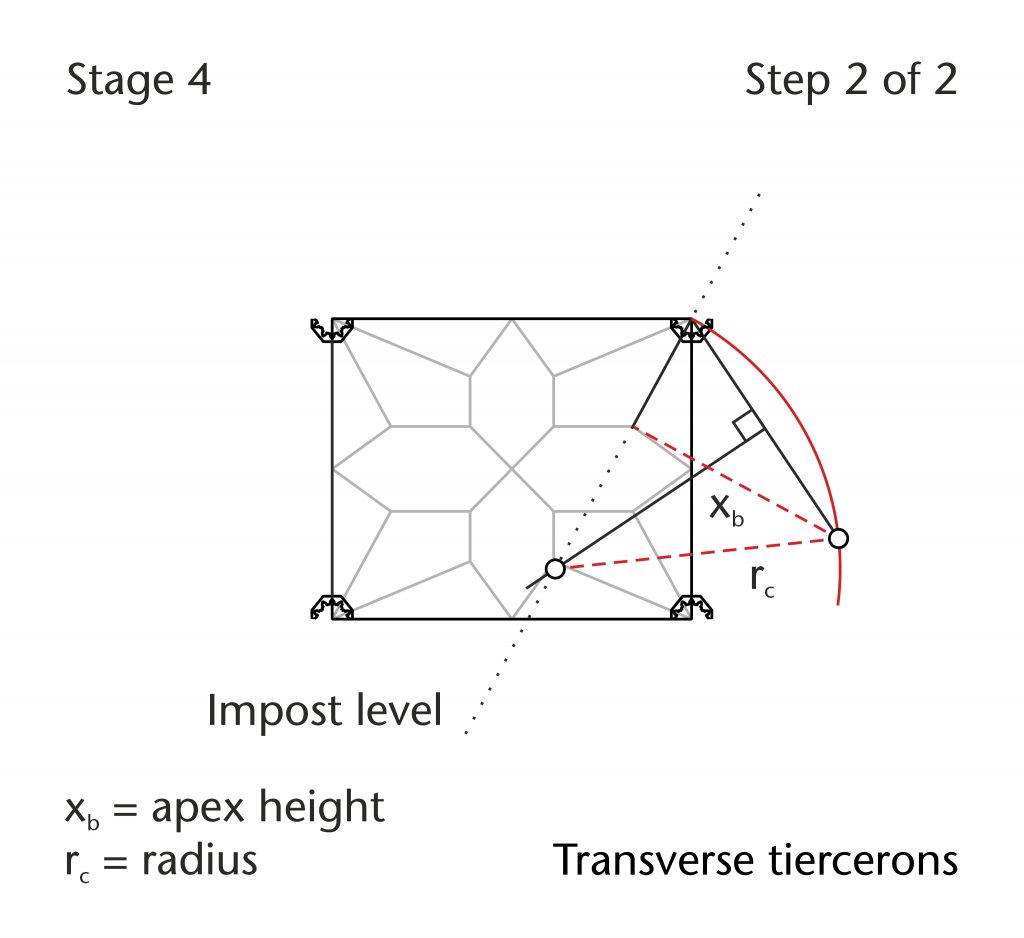
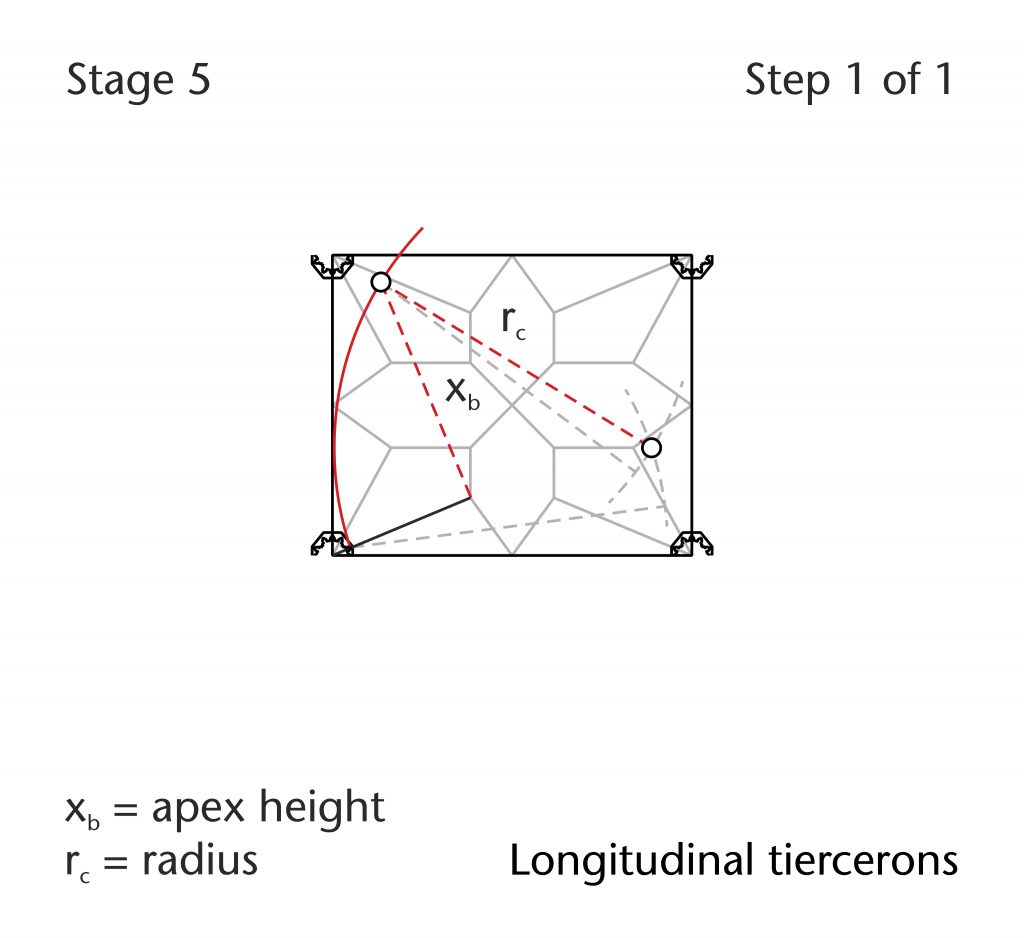
The next stage of our research is to study the geometry of the rib curvatures. This process involves comparing the recorded measurements to the expected parameters of a range of different geometrical methods for setting out rib curvatures. Each of these methods revolves around defining a particular set of measurements at the outset. Consequently, it is possible to work out which geometrical processes could have been used by considering which of the variables recorded in our data might have been fixed in advance. For example, in the chord method the apex height is defined at the outset, with the height of the centre being fixed at the level of the impost. Consequently, if we encounter a rib with an apex height provided by the window arch below and a centre located on the impost, then it is likely that the chord method was used to set out its geometry. By comparing measurements and methods in this way, we are able to propose a design process for each individual rib within the vault.
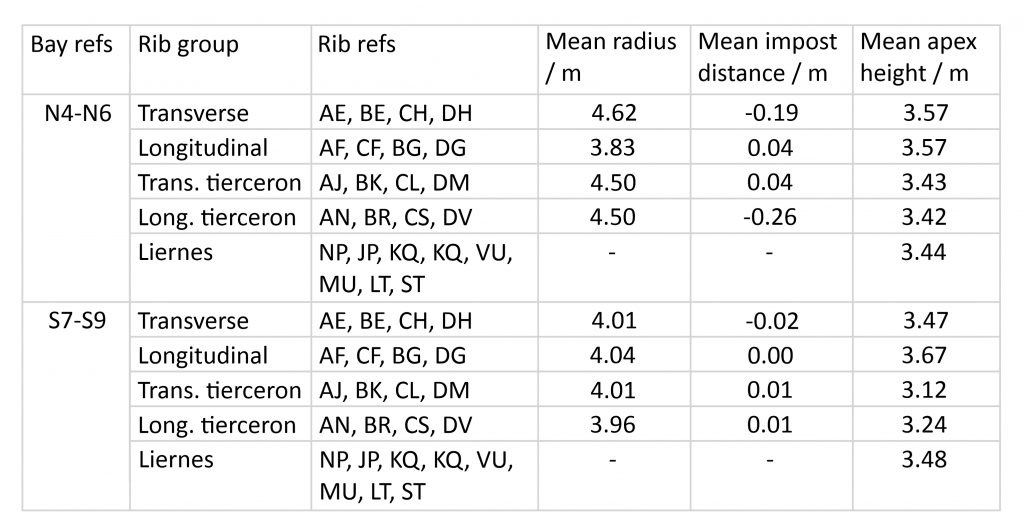
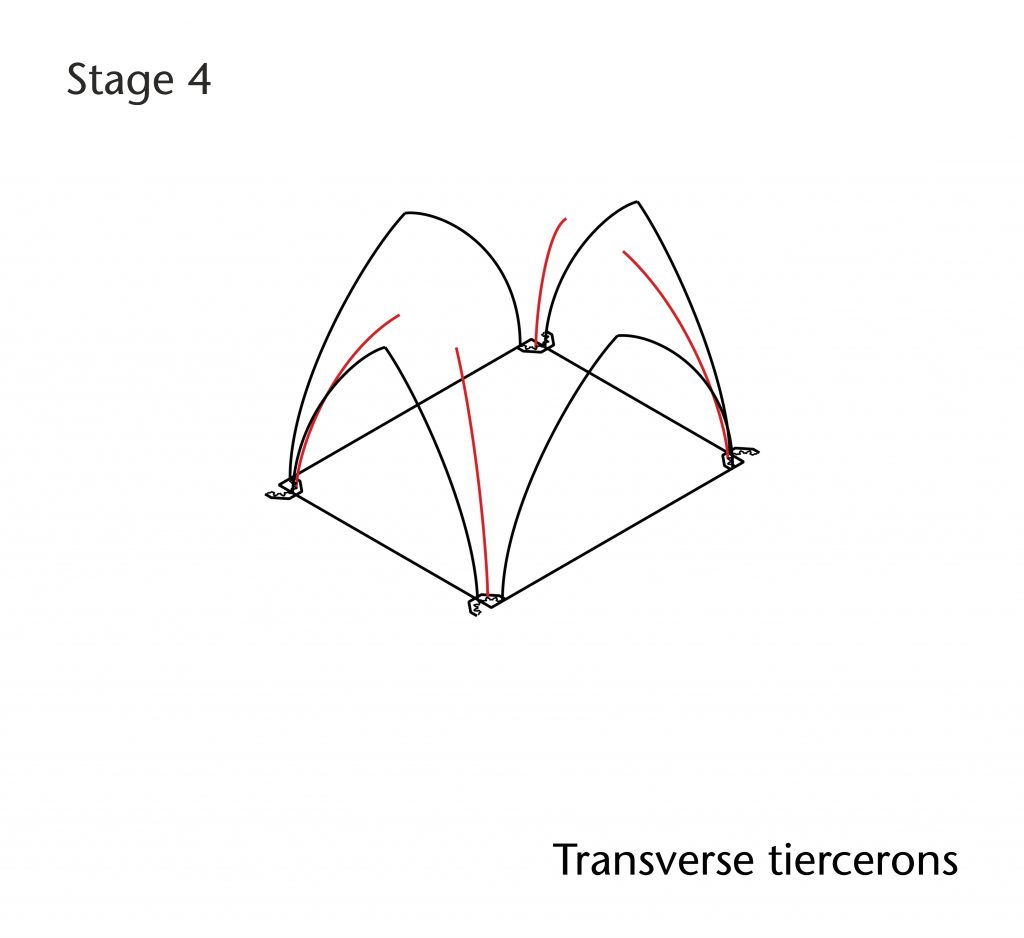
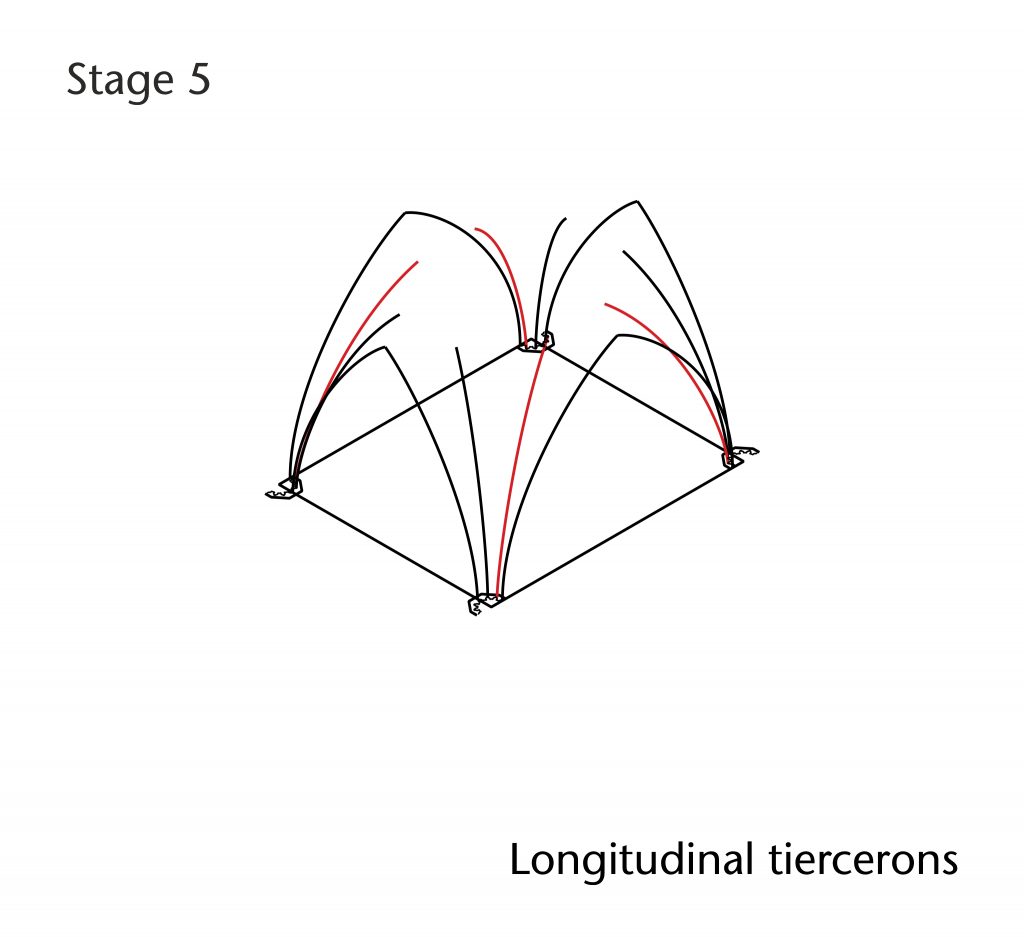
In bays N4-N6 of the choir aisles at Wells Cathedral, the apex heights of the transverse and longitudinal arches is very close (3.57/3.57m), suggesting that it could have been fixed in advance. As the impost distance for the longitudinal ribs is well within our tolerances for 0.00m (0.04m), it is possible that this was meant to be fixed at the level of the impost. This suggests that the radius may have been set out using the chord method, with the apex height being defined by the width of the bay. Yet whilst the same apex height was apparently used for the transverse rib, both the radius and impost distance were markedly different. The most likely explanation is that they were set out using the three circles method, with the radius (4.62m) perhaps being given by the distance from the floor level to the top of the abacus. For the transverse and longitudinal tiercerons the radius and apex height is near identical (4.50/4.50m and 3.42/3.43m), but the impost distance is markedly different (0.04/-0.26m). As the apex height could have been fixed using the diagonal distance from the centre of the bay (Z) to the corners (A, B, C and D) (3.40m), it is therefore likely that the chord method was used to set out the transverse tiercerons, with the defined radius being transferred to the longitudinal tiercerons using the three circles method.
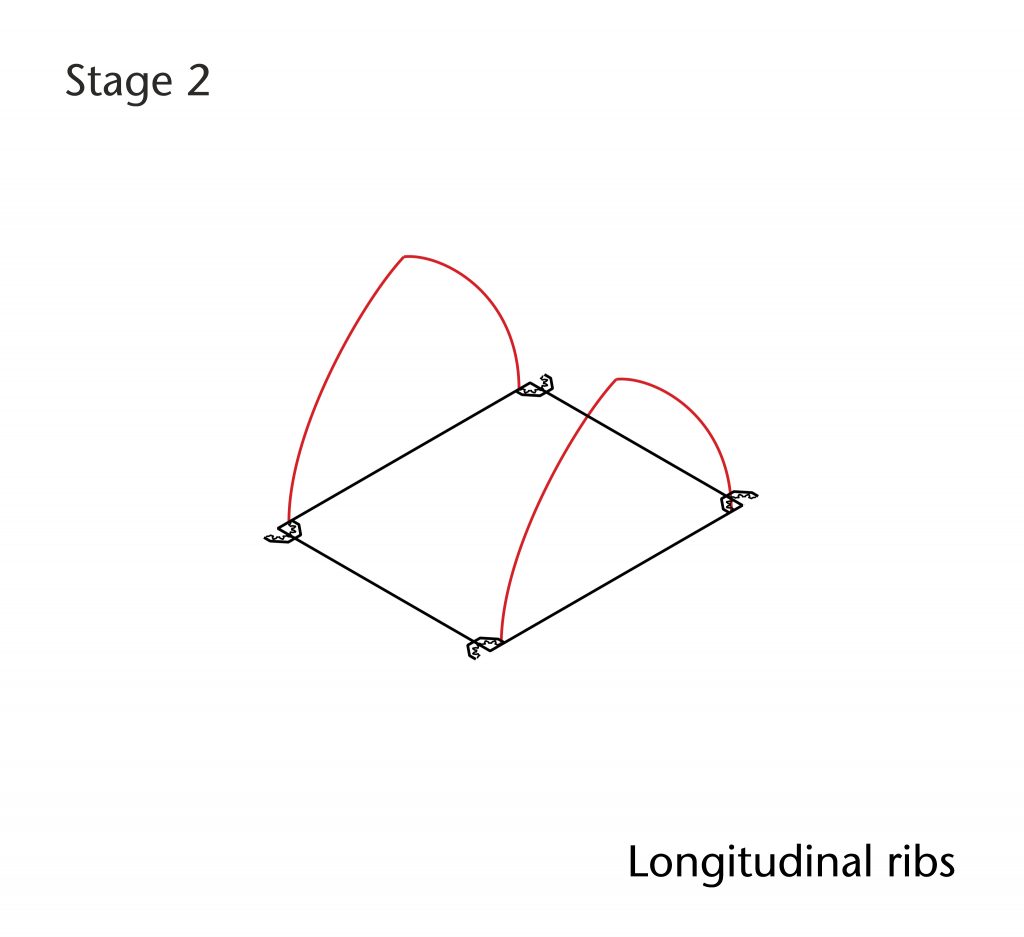
By contrast, the mean radius for all of the ribs in bays S7-S9 are well within our tolerance of ±0.10m. The mean impost distances are also extremely close to 0.00m, suggesting that in all cases the height of the centre was fixed at impost level. However, the apex height varies considerably from one rib to another. The starting point was probably the longitudinal rib, where the apex would have been fixed by the arches of the existing arcade. The curvature was probably defined using the chord method, providing a fixed radius which could be used throughout the remaining ribs of the vault. As the centre was consistently positioned at impost level, it is likely that the radius was transferred using the two circles method, a process which would also account for the variability in the vault’s height.
Design hypothesis
Once a potential design process has been worked out, it is written down as a coherent design hypothesis. This consists of a step-by-step process for setting out the vault’s ribs, starting with the plan and moving sequentially through each of the ribs. A variety of different 2D and 3D CAD software are used to produce diagrams of these hypotheses, allowing us to create a permanent record of our research process and findings. However, each of these hypotheses is only provisional, as they represent only a theoretical understanding of the vault’s geometry. In order to test their accuracy, it is therefore necessary to demonstrate them practically by comparing them directly to the evidence provided by our laser scans. None of our hypotheses are the final word on the subject and each is periodically revisited as new information or analytical techniques come to light.
Further reading
- Buchanan, A., Hillson, J. and Webb, N. (2021). Digital Analysis of Vaults in English Medieval Architecture. New York and London: Routledge.
- Buchanan, A. & Webb, N. (2017). ‘Creativity in Three Dimensions: An Investigation of the Presbytery Aisles of Wells Cathedral’, British Art Studies, Issue 6.
- Webb, N. & Buchanan, A. (2017). ‘Tracing the past: A digital analysis of Wells cathedral choir aisle vaults’, Digit. Appl. Archaeol. Cult. Herit., 4, March 2017, pp. 19–27.
- Webb, N. & Buchanan, A. (2017) ‘Tracing the Past – A Digital Analysis of the North Transept and Chancel Vaults at Nantwich St Mary’s Church‘, Digital Past Conference 2017, Newport, Wales, 15-16 February 2017.
- Buchanan A. & Webb N. (2018). ‘Two- and Three-dimensional Geometry in Tierceron Vaults: A Case Study of Exeter Cathedral’, Sixth International Congress on Construction History, Brussels, Belgium, 9-13 Jul 2018, pp. 391-397.

3 Comments
[…] Find out more about how we develop our design hypotheses […]
[…] Find out more about the process of interpreting our data to produce design hypotheses […]
[…] Find out more about vault design in the choir aisles at Wells View all of our 3D models of vaults at Wells […]