Whilst a theoretical hypothesis for the design process of a medieval vault can be worked out using the measured data alone, it must still be tested practically to see whether or not it successfully reproduces the form of the actual vault. The simplest method for doing this is to draw out the geometry of the vault using 3D modelling software, producing a new wireframe which can be compared directly to our traced data. If there is a good match between the hypothesis and the data, then it can provisionally be accepted as a plausible design process for the vault. However, if there is not a good match, then we return to the data and try out other possibilities.
Such a process can be very time-consuming, especially when multiple modelling attempts are required. Consequently, for some of our sites we have adopted an alternative method known as parametric modelling. This is an approach adapted from modern architectural practices, which involve using advanced rule-based or parametric software to generate designs automatically based on a set of variable parameters. A programming language is used to set out a series of geometrical relationships between a set of component parts. This provides a set of rules can be applied to a defined set of starting measurements, which can either be fixed or varied in order to generate a range of different design options quickly and efficiently.
Parametric modelling
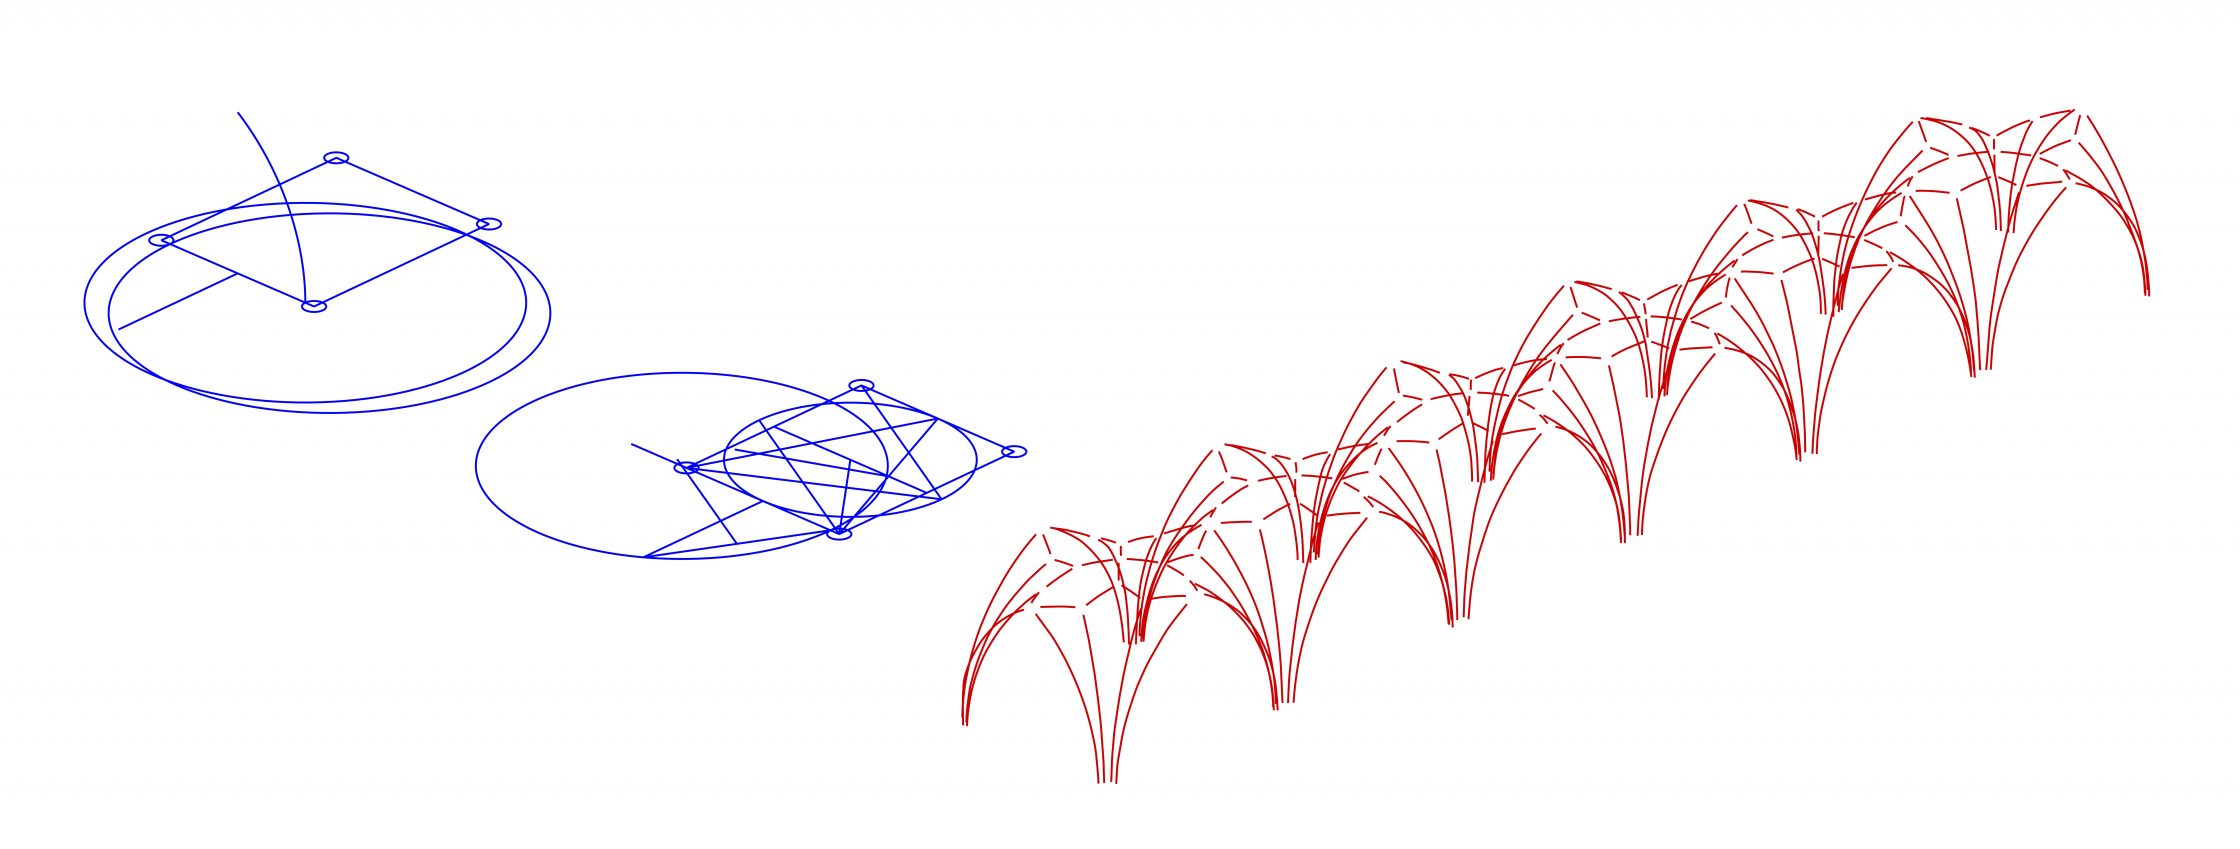
Whereas architects tend to use parametric software as a creative design tool, we instead use it as an analytical tool. The geometrical methods which we have identified for setting out ribs are converted into programs which could generate rib curvatures automatically based on a specific set of starting parameters (radius, apex height, vertical position of centre etc.). These are all connected together into a larger program based on the vault plan, allowing the effects of different proportional systems, measurements and geometrical methods to be tested for each rib in the vault. This parametric model allows us to generate wireframe models of our design hypotheses quickly and accurately. The resulting geometry can then be superimposed on the mesh model directly, enabling us to test its accuracy through direct visual comparison with both the traced intrados lines and the scan data itself.
The software which we use to achieve this is Grasshopper 3D, a plugin for Rhinoceros. Grasshopper is an advanced visual programming language which works by connecting together a series of ‘components’ onto a ‘canvas’. Each of these functions rather like a component in an electronic circuit, possessing its own inputs and outputs as well as providing an interface for operating the parametric model. A module of parameters and specialist functions is set up for the geometry of the vault plan, followed by similar modules for each geometrical method which could have been used to set out the ribs. A selection interface of buttons and switches is used to define which modules are in use for each particular rib, allowing the geometrical method and starting measurements to be varied as necessary.
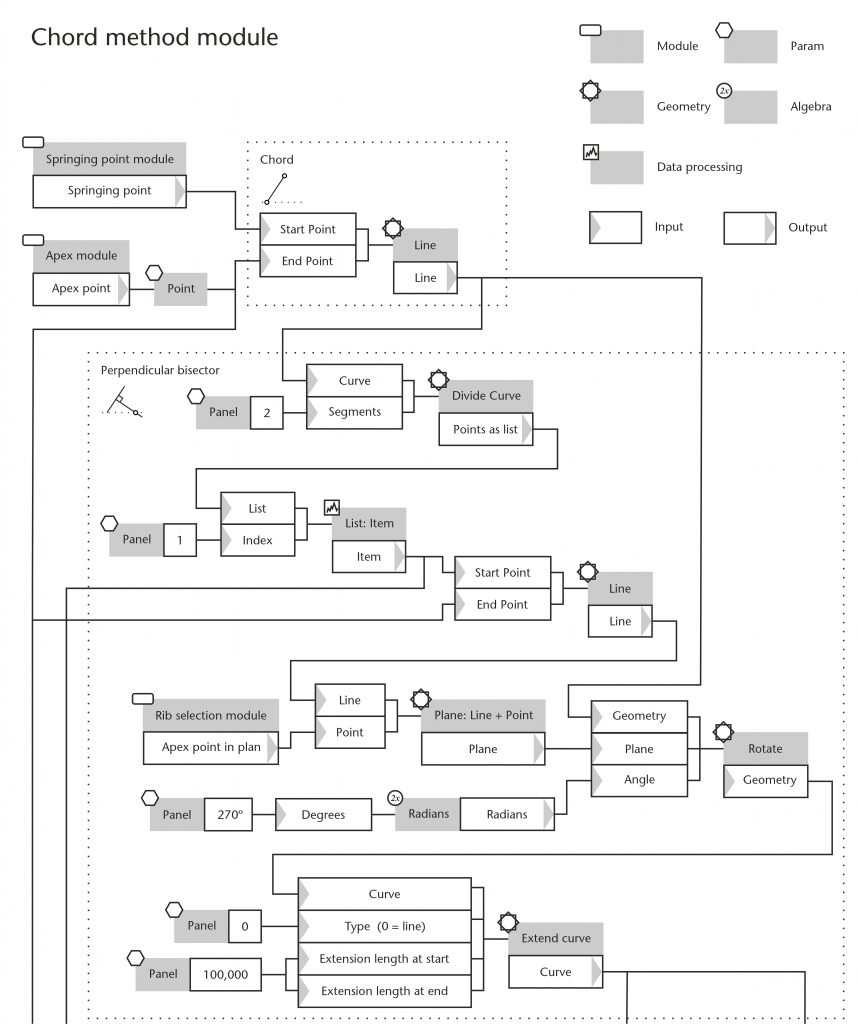
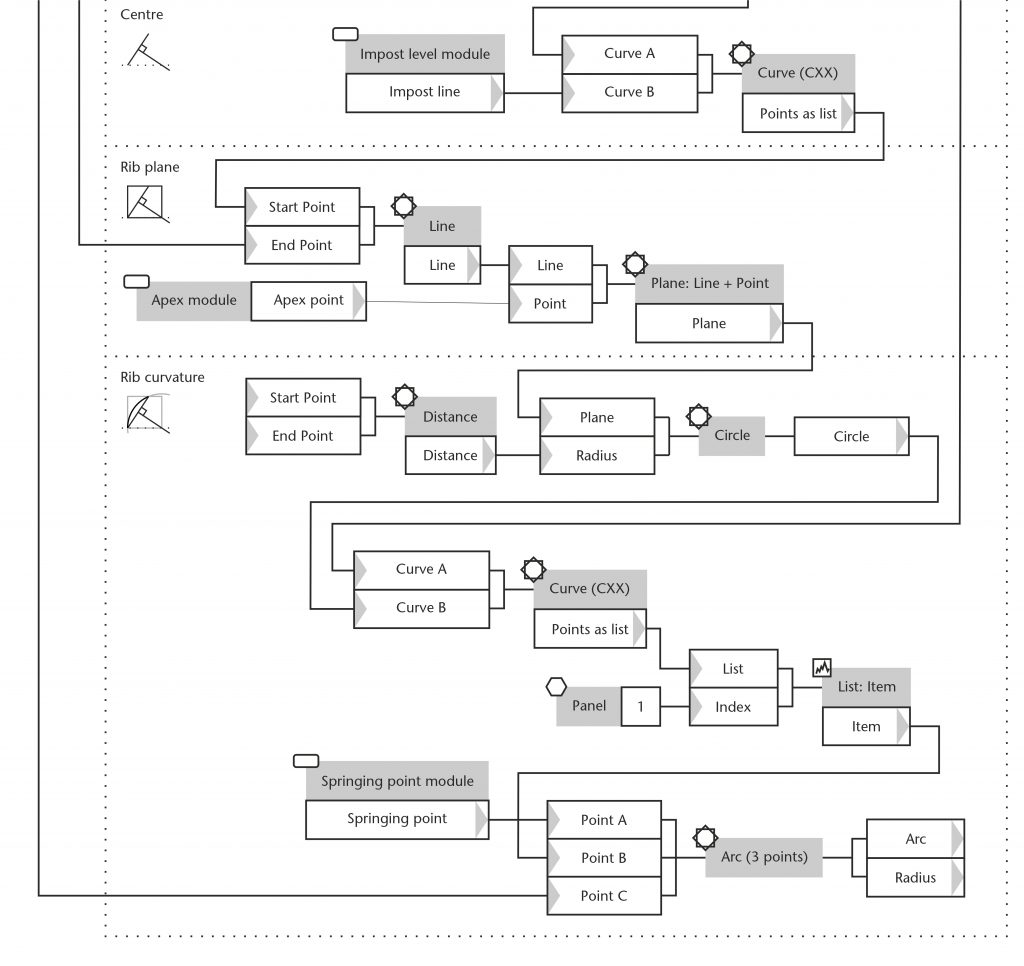
Each module within the parametric model is built up using a range of distinct components within Grasshopper. ‘Params’ define the parameters of the model, allowing the user to define a custom set of input variables. These can take the form of switches, sliders and numerical values as well as one-dimensional (distances), two-dimensional (lines, curves, planes) and even three-dimensional (points, coordinates, vectors, solids or mesh models) data. These are then connected to a variety of specialist components which perform particular functions, including data processing, algebra and geometrical operations.
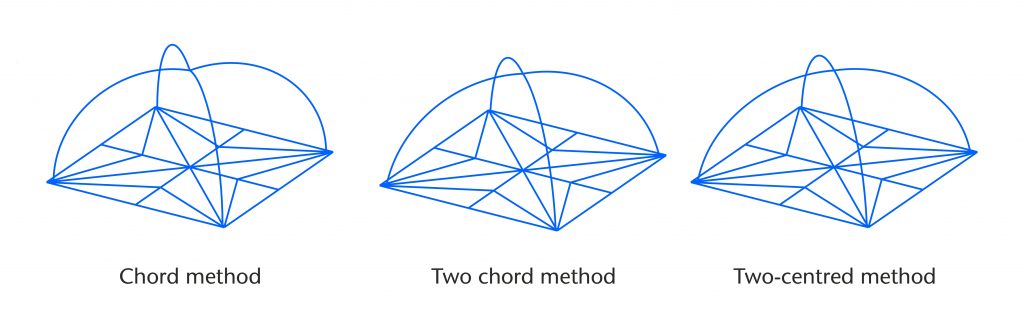
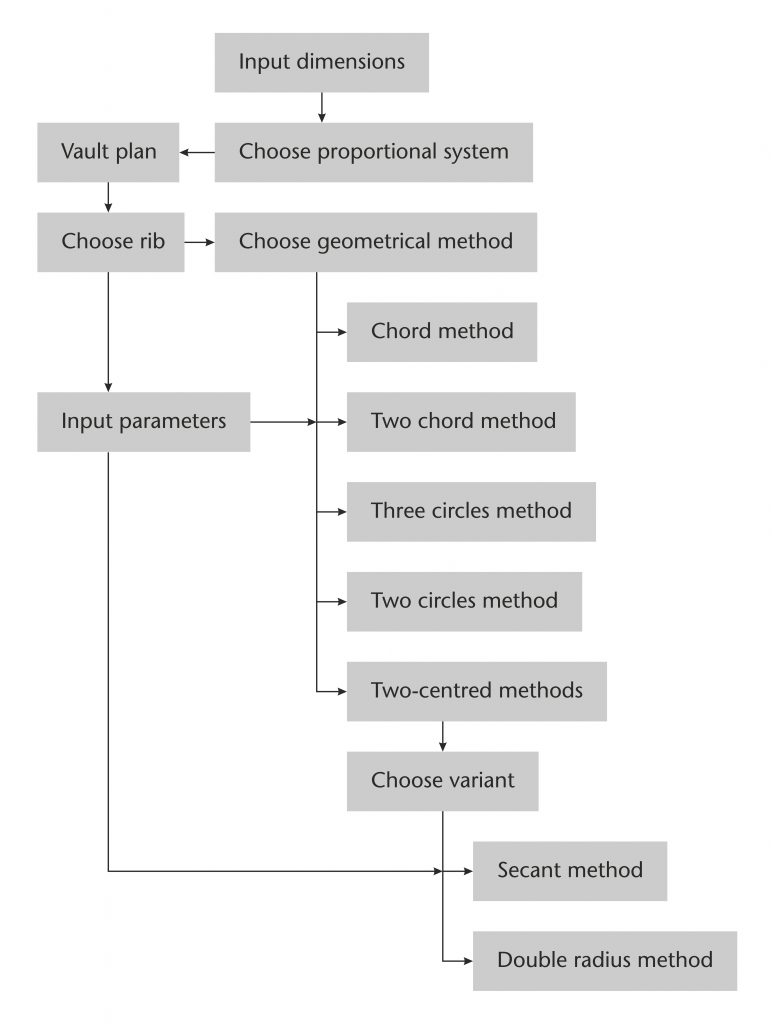
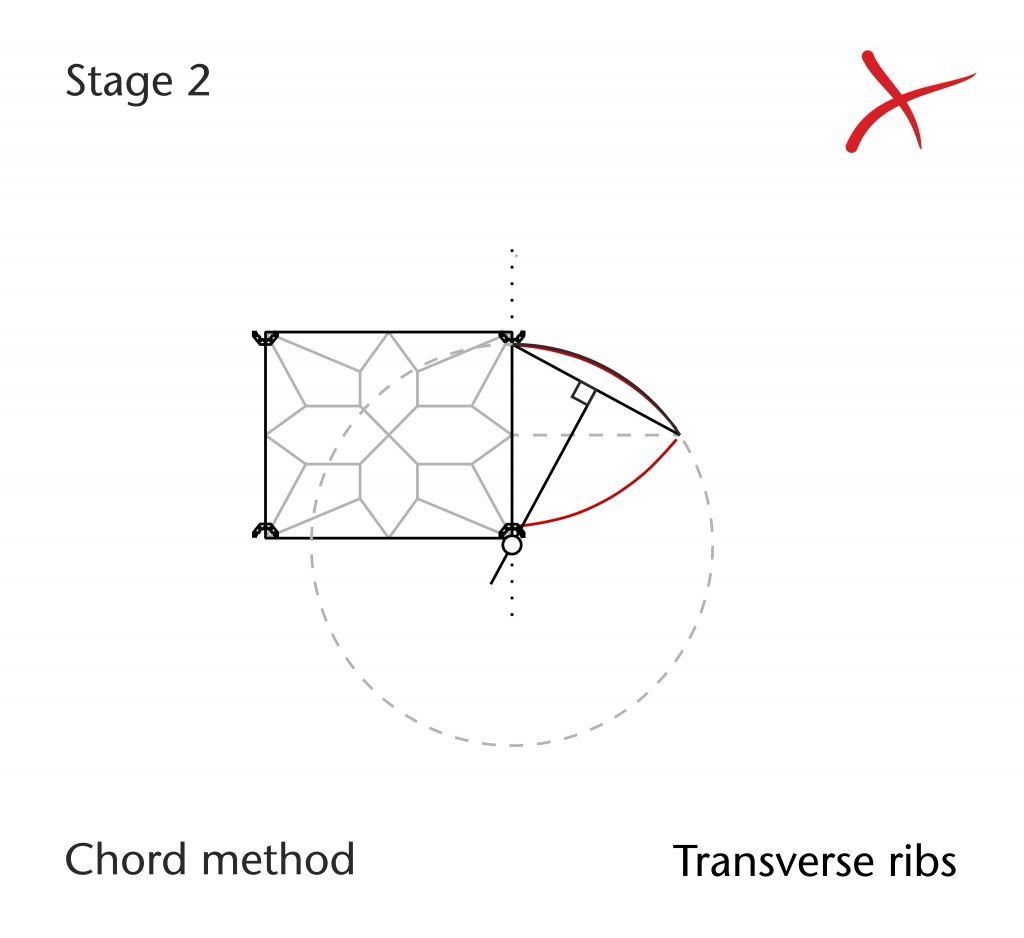
Components are arranged in a logical sequence using a system of connecting lines analogous to those in a flow chart. The process is split up into a series of smaller geometrical operations, each of which is developed as a sub-module. In the chord method module, these consist of (1) drawing the initial chord from springing point to apex, (2) constructing the perpendicular bisector of the chord, (3) defining the position of centre on the impost line, (4) constructing the plane of the rib in three dimensions and (5) drawing the rib curvature. The result will be a single curve connecting springing point to apex.
Once a design hypothesis has been completed, it can then be tested using the programmable parametric model. First, the geometrical structure, proportions and dimensions of the plan are inserted into the model and the location of the springing points defined, providing a provisional set of start and end points for each rib. A selection interface is then used to choose which rib was to be processed first, followed by which geometrical method module is to be used. Then another interface is used to input a set of variable parameters specific to that particular method (e.g. apex height, radius, impost level). The rib is then generated automatically, allowing us to move quickly on to the next. This process continues rib-by-rib until the entire design hypothesis has been worked out in three dimensions.
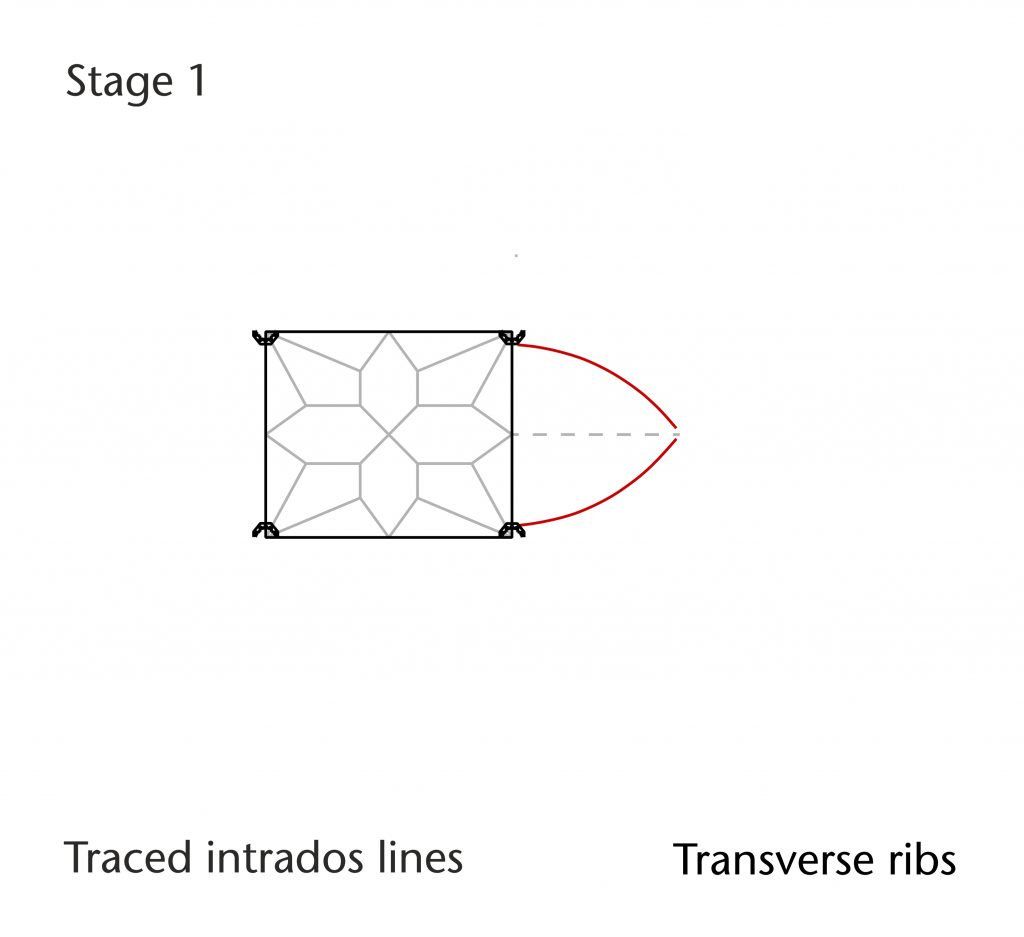

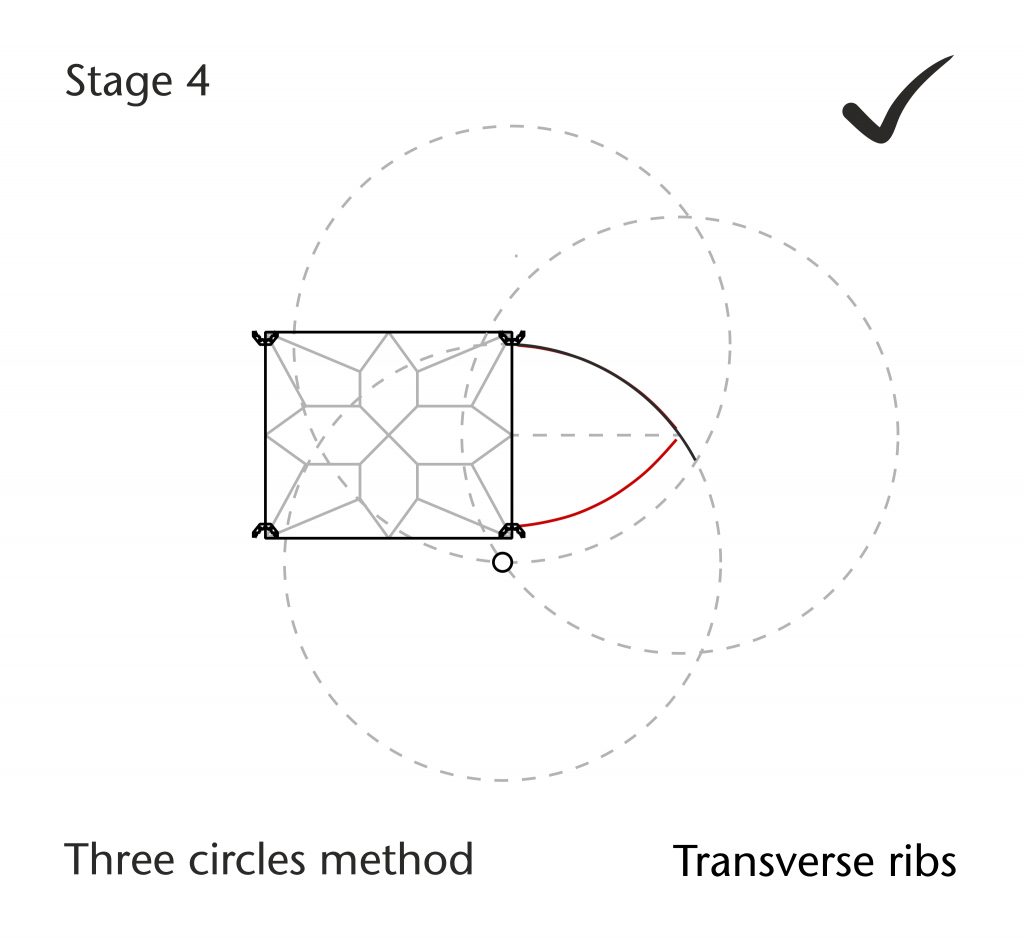
The resulting wireframe model is then superimposed onto the mesh model and compared to the traced intrados lines within Rhinoceros. If there is a close match between the tracing and the wireframe, then it seems reasonable to conclude that the hypothesis was a good approximation for the medieval design process. However, if they do not match closely, then we instead return to the raw data and try alternative possibilities, using the parametric model to test them against our traced data until the best result is found. Through this rigorous process of hypothesising, testing, revising and testing again, we are able to produce plausible design processes which are as close as possible to the measurable data of the actual vaults.
Further reading
- Buchanan, A., Hillson, J. and Webb, N. (2021). Digital Analysis of Vaults in English Medieval Architecture. New York and London: Routledge.
- Webb, N. & Buchanan, A. (2019). ‘Digitally aided analysis of medieval vaults in an English cathedral, using generative design tools’, International Journal of Architectural Computing, July 2019.


3 Comments
[…] Find out more about our methods of testing design hypotheses […]
[…] Find out more about how we test our design hypotheses using parametric modelling […]
[…] Find out more about how we develop our design hypotheses Find out more about how we test our design hypotheses […]